Beamex Blog
Beamex blog provides insightful information for calibration professionals, technical engineers as well as potential and existing Beamex users. The blog posts are written by Beamex’s own calibration and industry experts or by guest writers invited by Beamex.
Most recent blog posts
Accredited vs. Non‑Accredited Calibration Explained

What Is a Calibration Certificate? Everything You Need to ...
Jul 20, 2026
Accredited vs. Non‑Accredited Calibration Explained
When it comes to calibrating your calibration equipment, not all services are created equal. You ...
Jun 01, 2026
What Is a Calibration Certificate? Everything You Need to Know
Whether you're an engineer, quality manager, or someone responsible for compliance, you've likely ...

Apr 07, 2026
The Digital Calibration Certificate (DCC) is coming - Is your business ready to benefit?
The Digital Calibration Certificate (DCC) is a genuine game changer for process industries, ...

Feb 18, 2026
Loop Calibration vs. Instrument Calibration
When calibrating process instruments, there is more than one way to approach the task. While ...
Jan 13, 2026
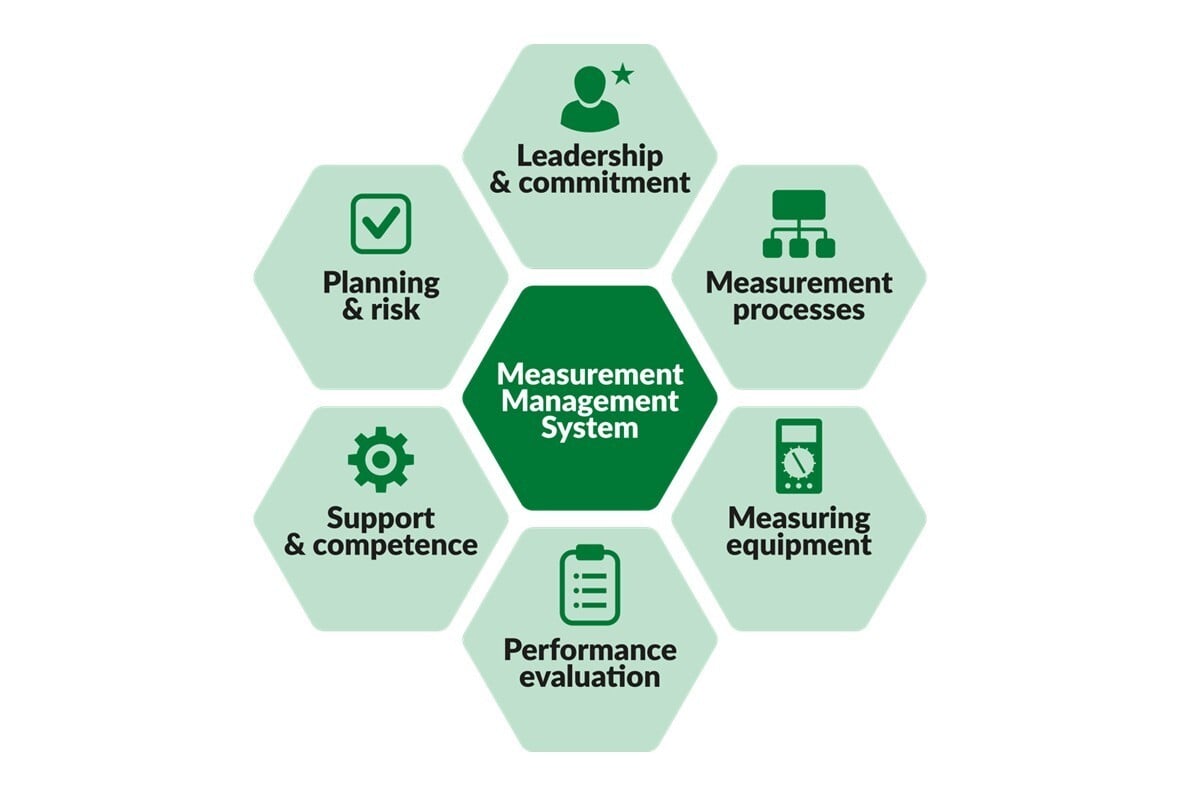
ISO 10012 Is Being Updated: What’s Changing and What It Means for Calibration
Update February 2026: The revised ISO 10012:2026 standard has been officially published in February ...
Dec 04, 2025
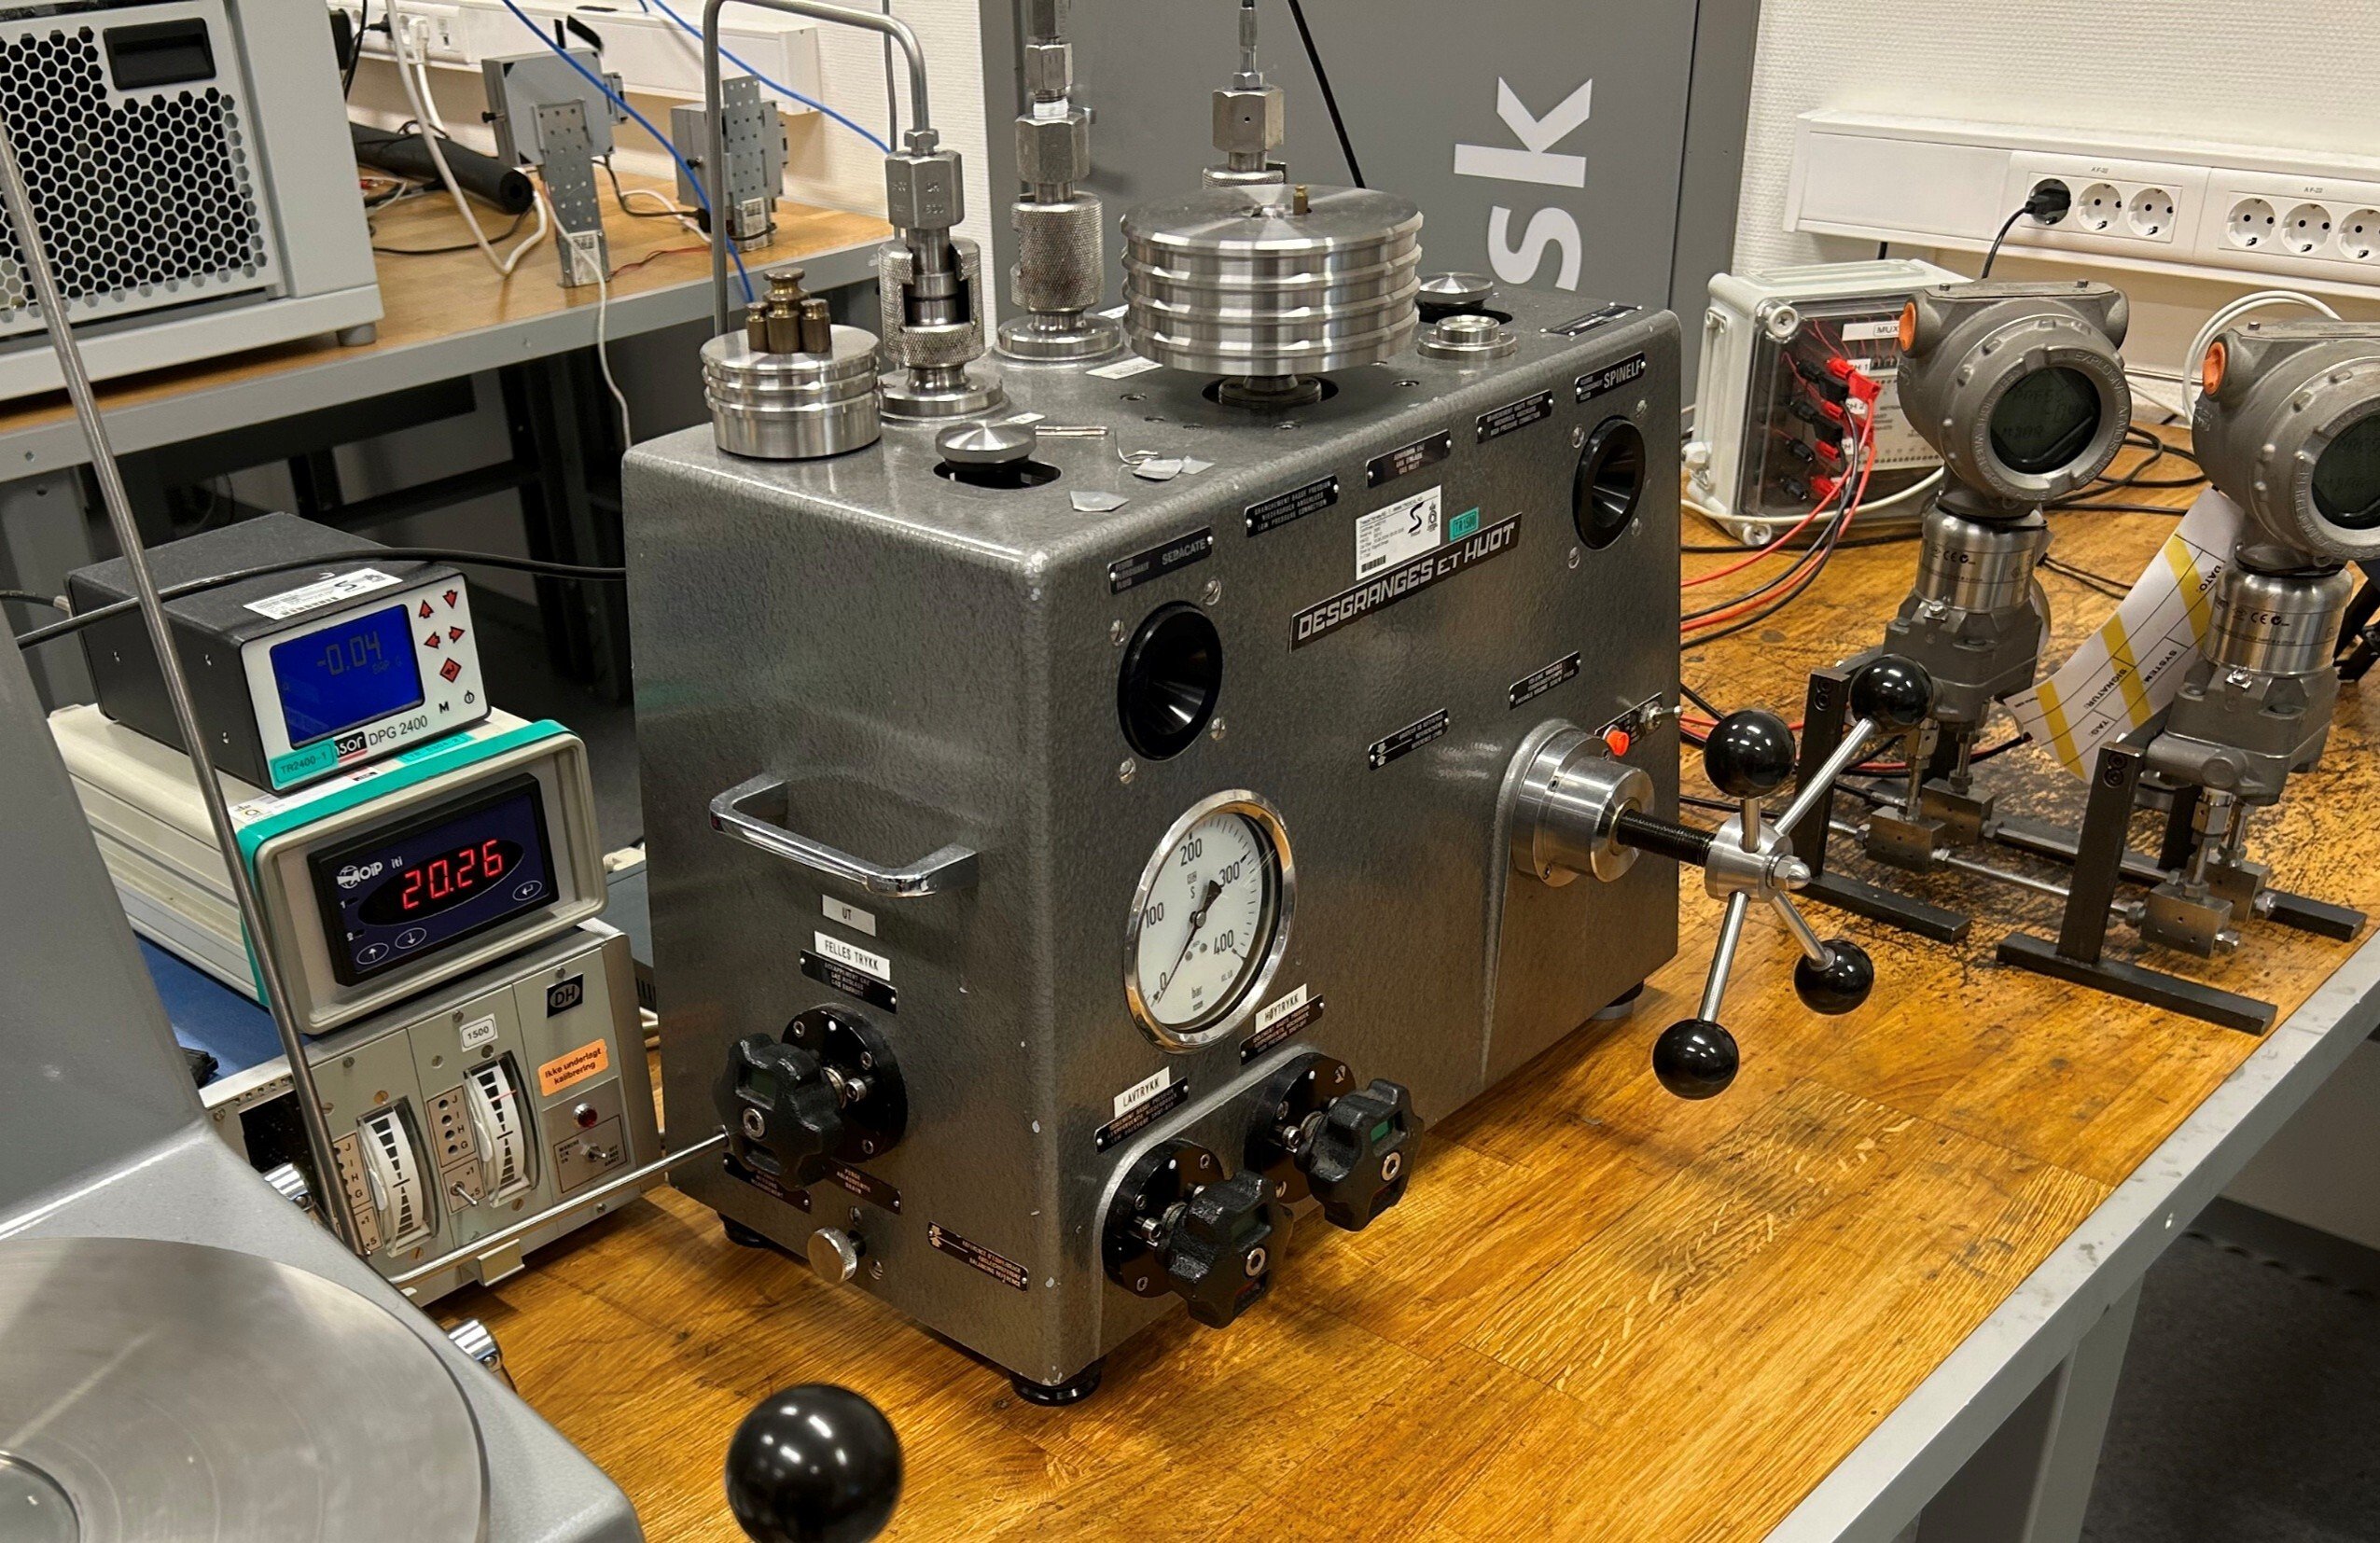
Footprinting in Differential Pressure Transmitter Calibration
Differential pressure transmitters are widely used in process industries to measure pressure, flow, ...
.jpg)
Aug 12, 2025
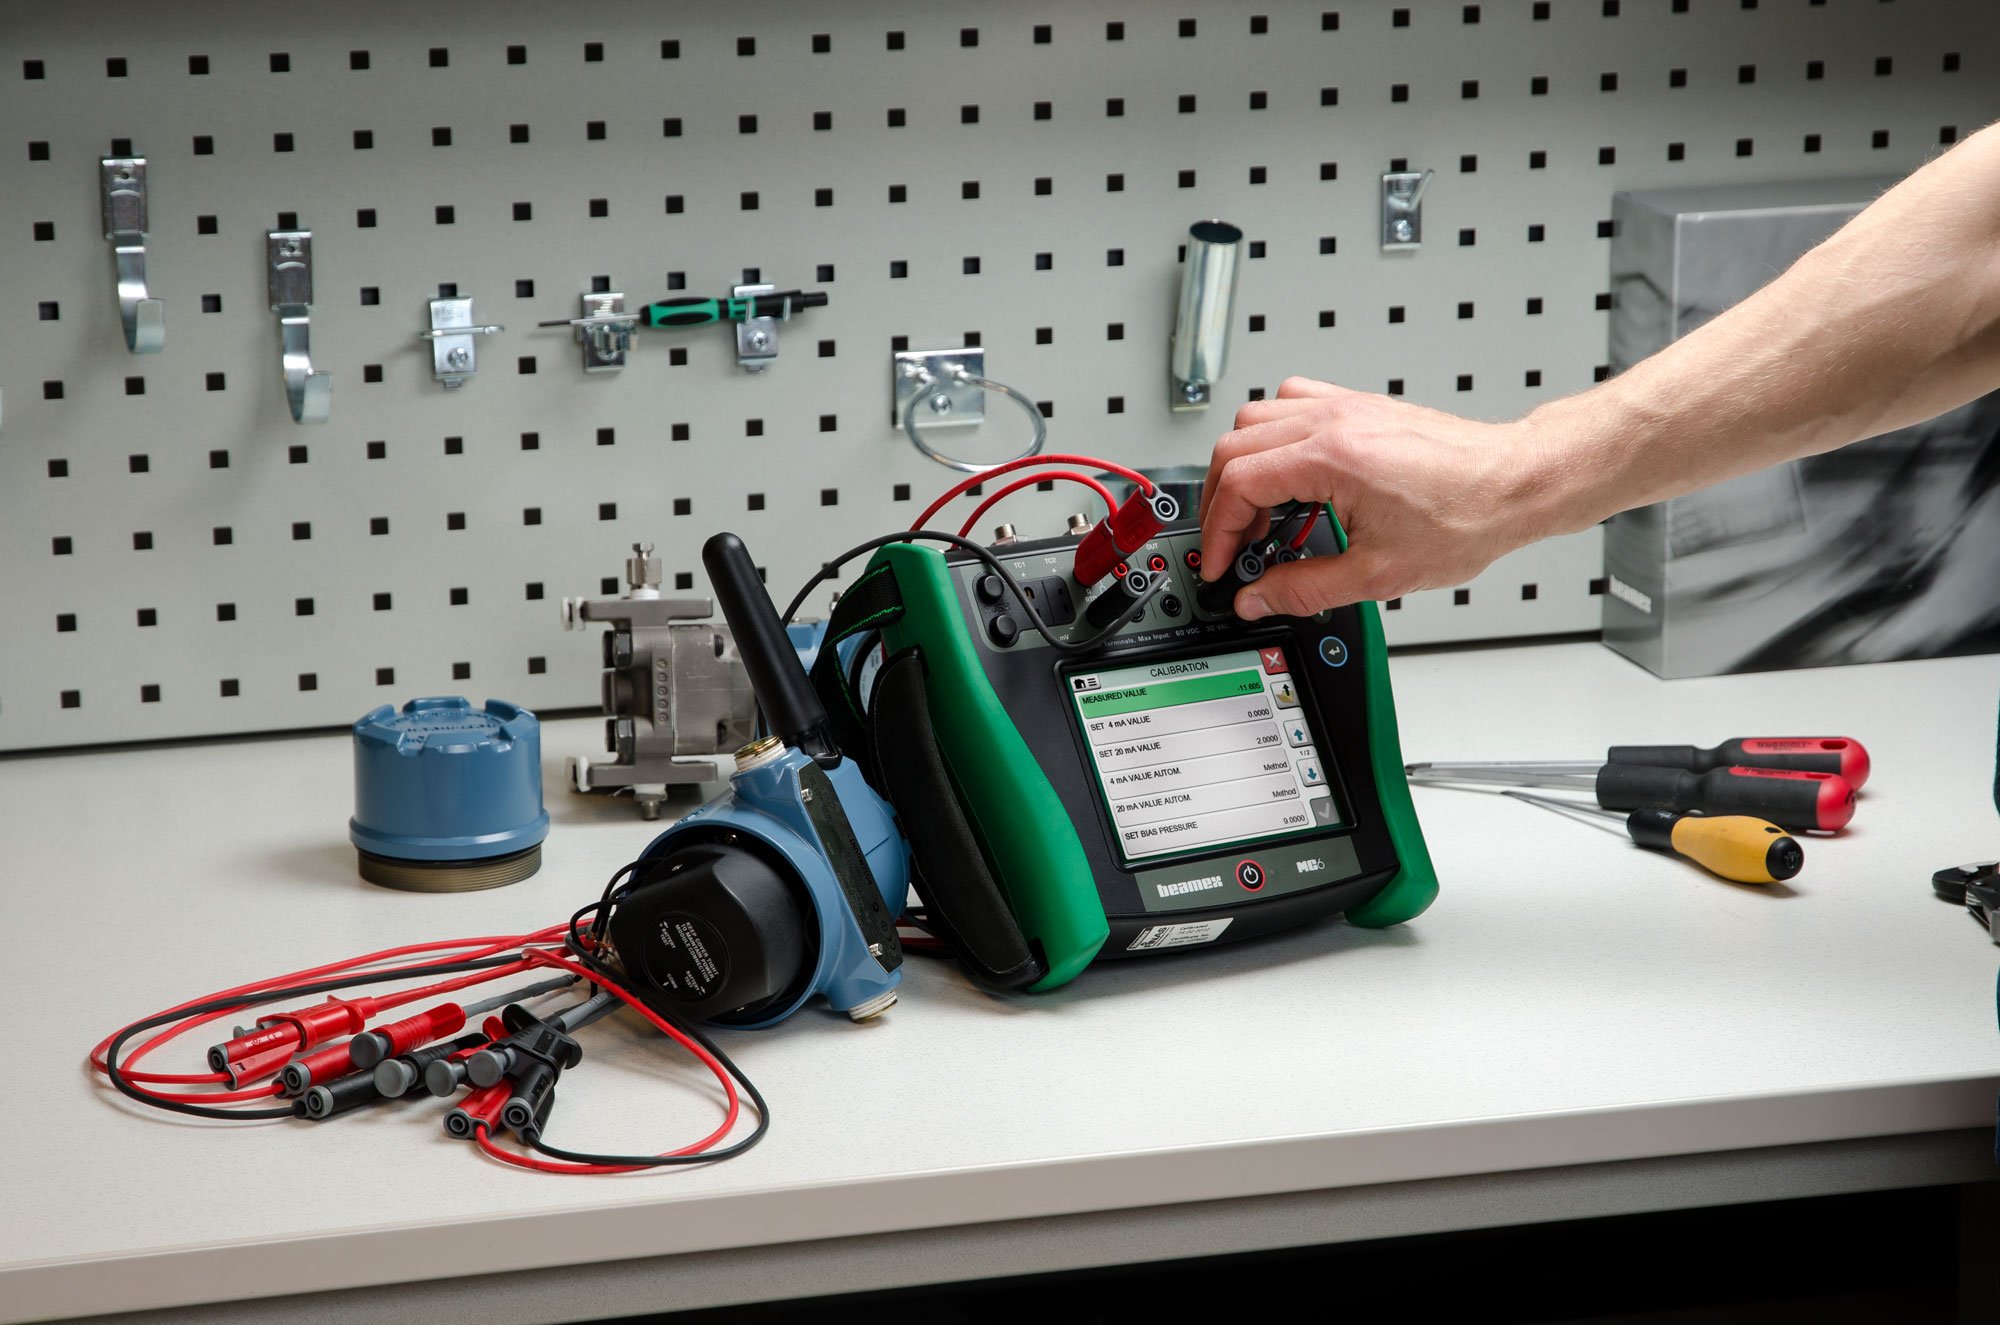
Comparing Multifunction and Single-Function Process Calibrators
A lot of calibrations are done in the process industry every day to keep the measurements accurate, ...
Jun 17, 2025
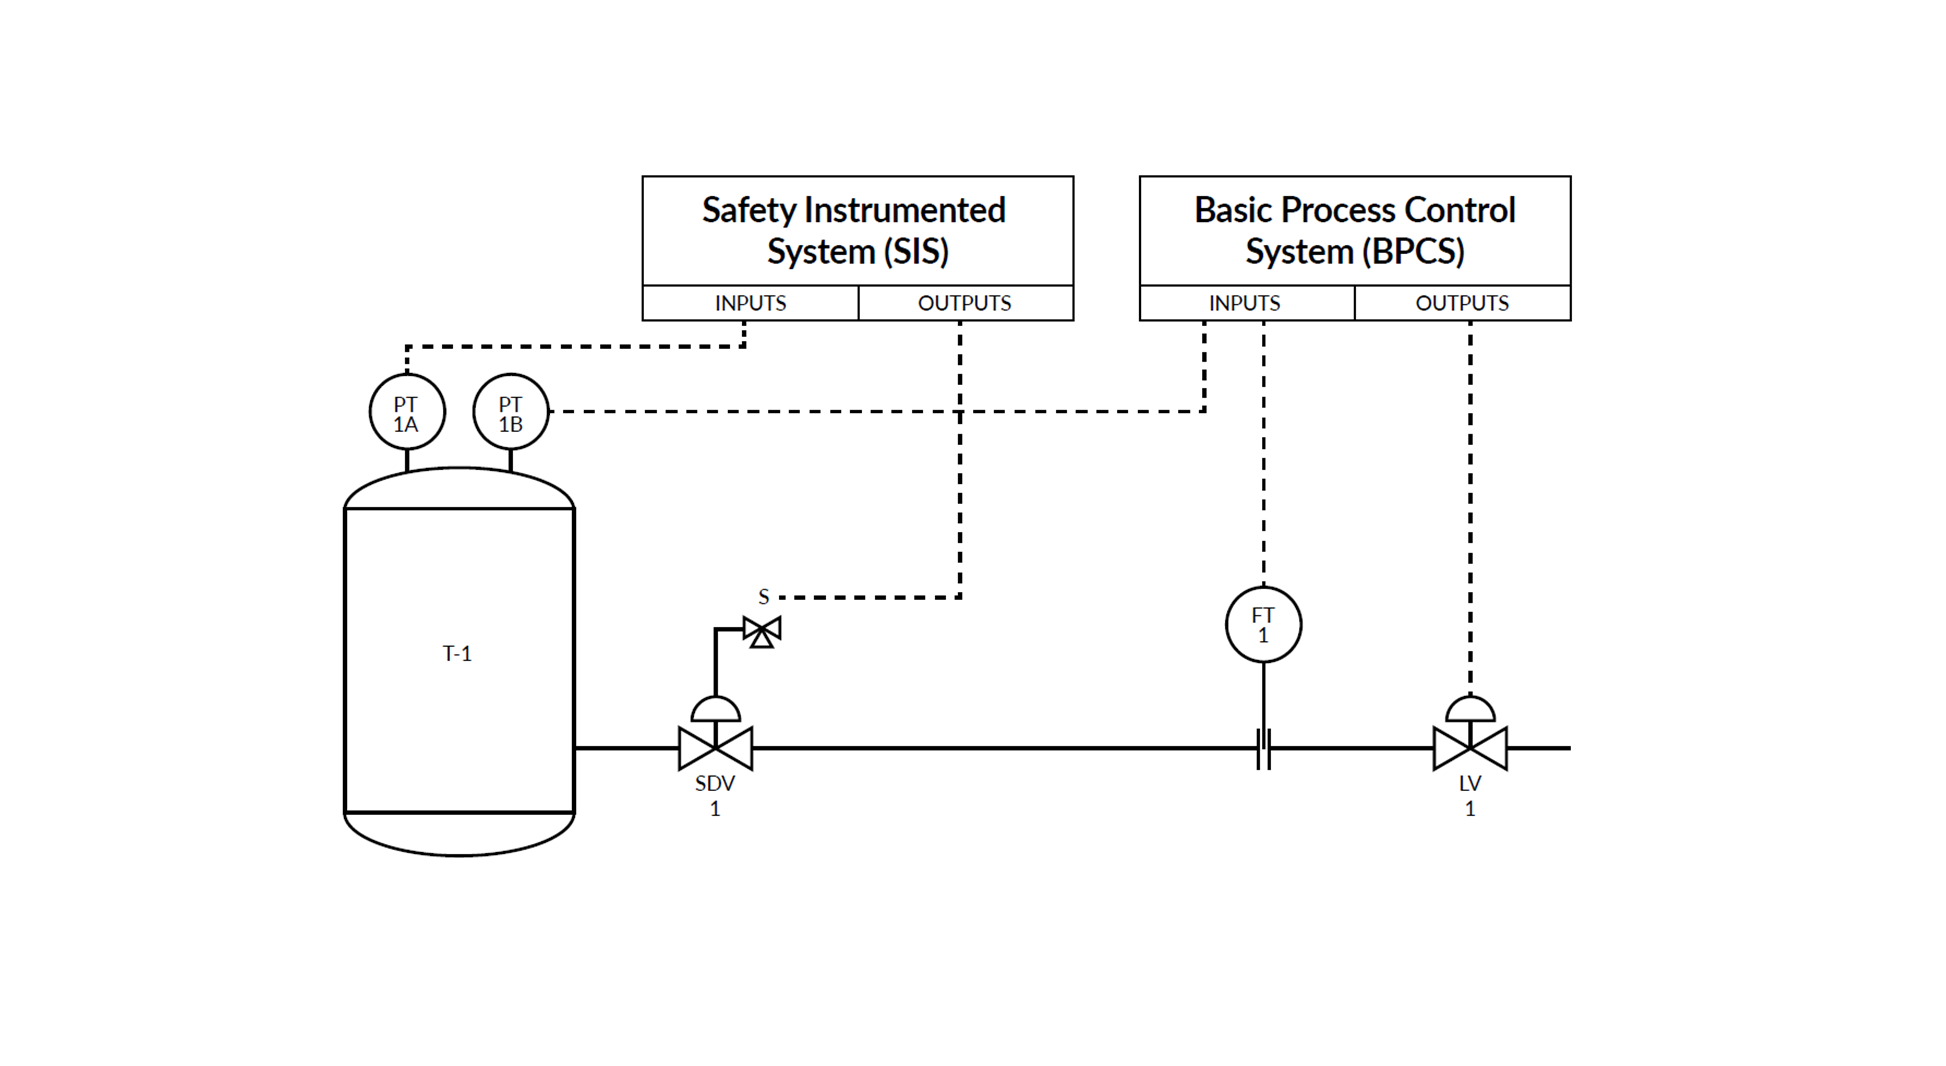
Understanding Safety Instrumented Systems (SIS) and the importance of calibration
In industries like oil and gas, chemicals, pharmaceuticals, and power generation, safety is not ...

Mar 27, 2025
A Buyer’s Guide to Calibration Management Software
Making smart decisions for long-term calibration success In today’s process industries – whether ...

Feb 20, 2025
Cloud vs. On-Premises Calibration Solutions
In the world of calibration management, choosing the right deployment model for your software makes ...
Feb 04, 2025
The First 50 Years: How Beamex and the Process Industry Have Evolved Together
Image: Beamex founders in the mid 1970s Beamex was founded in 1975, so in 2025 we’ll be celebrating ...
Jan 08, 2025
HART Communicator vs. HART Calibrator: Understanding the Key Differences
I wanted to write about a topic that is often discussed yet poorly understood: using a HART ...

Dec 18, 2024
Industrial Pressure Calibration Course [eLearning]
In this blog post, we want to share with you our new free eLearning course on industrial pressure ...
.png)
Aug 23, 2024
Calibration Process Savings Calculator [Online calculator]
Are you ready to uncover potential savings within your calibration processes? In this blog, we’re ...
.png)
Jul 04, 2024
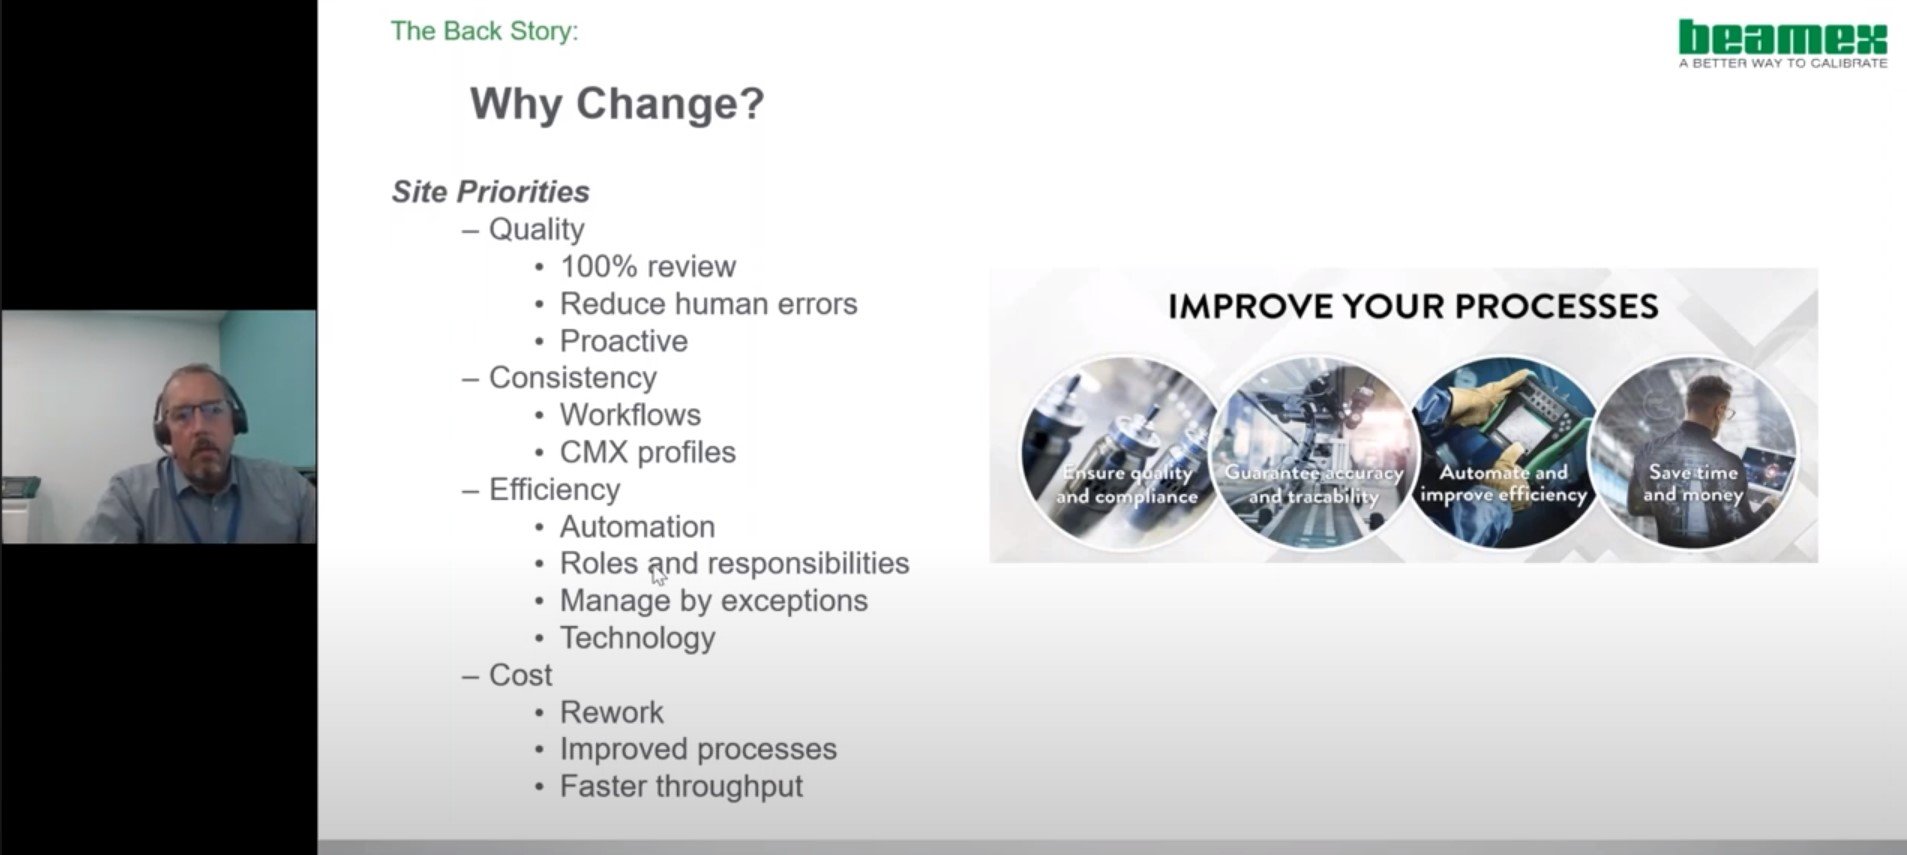
Revolutionizing calibration services with technology - case story [webinar]
In today's fast-paced world, managing calibration services efficiently is critical. At Douglas ...

Jun 19, 2024
How to get your boss to buy you a new calibrator
When you work with something, it's so much easier if you have the proper tools, right? The same ...
May 23, 2024
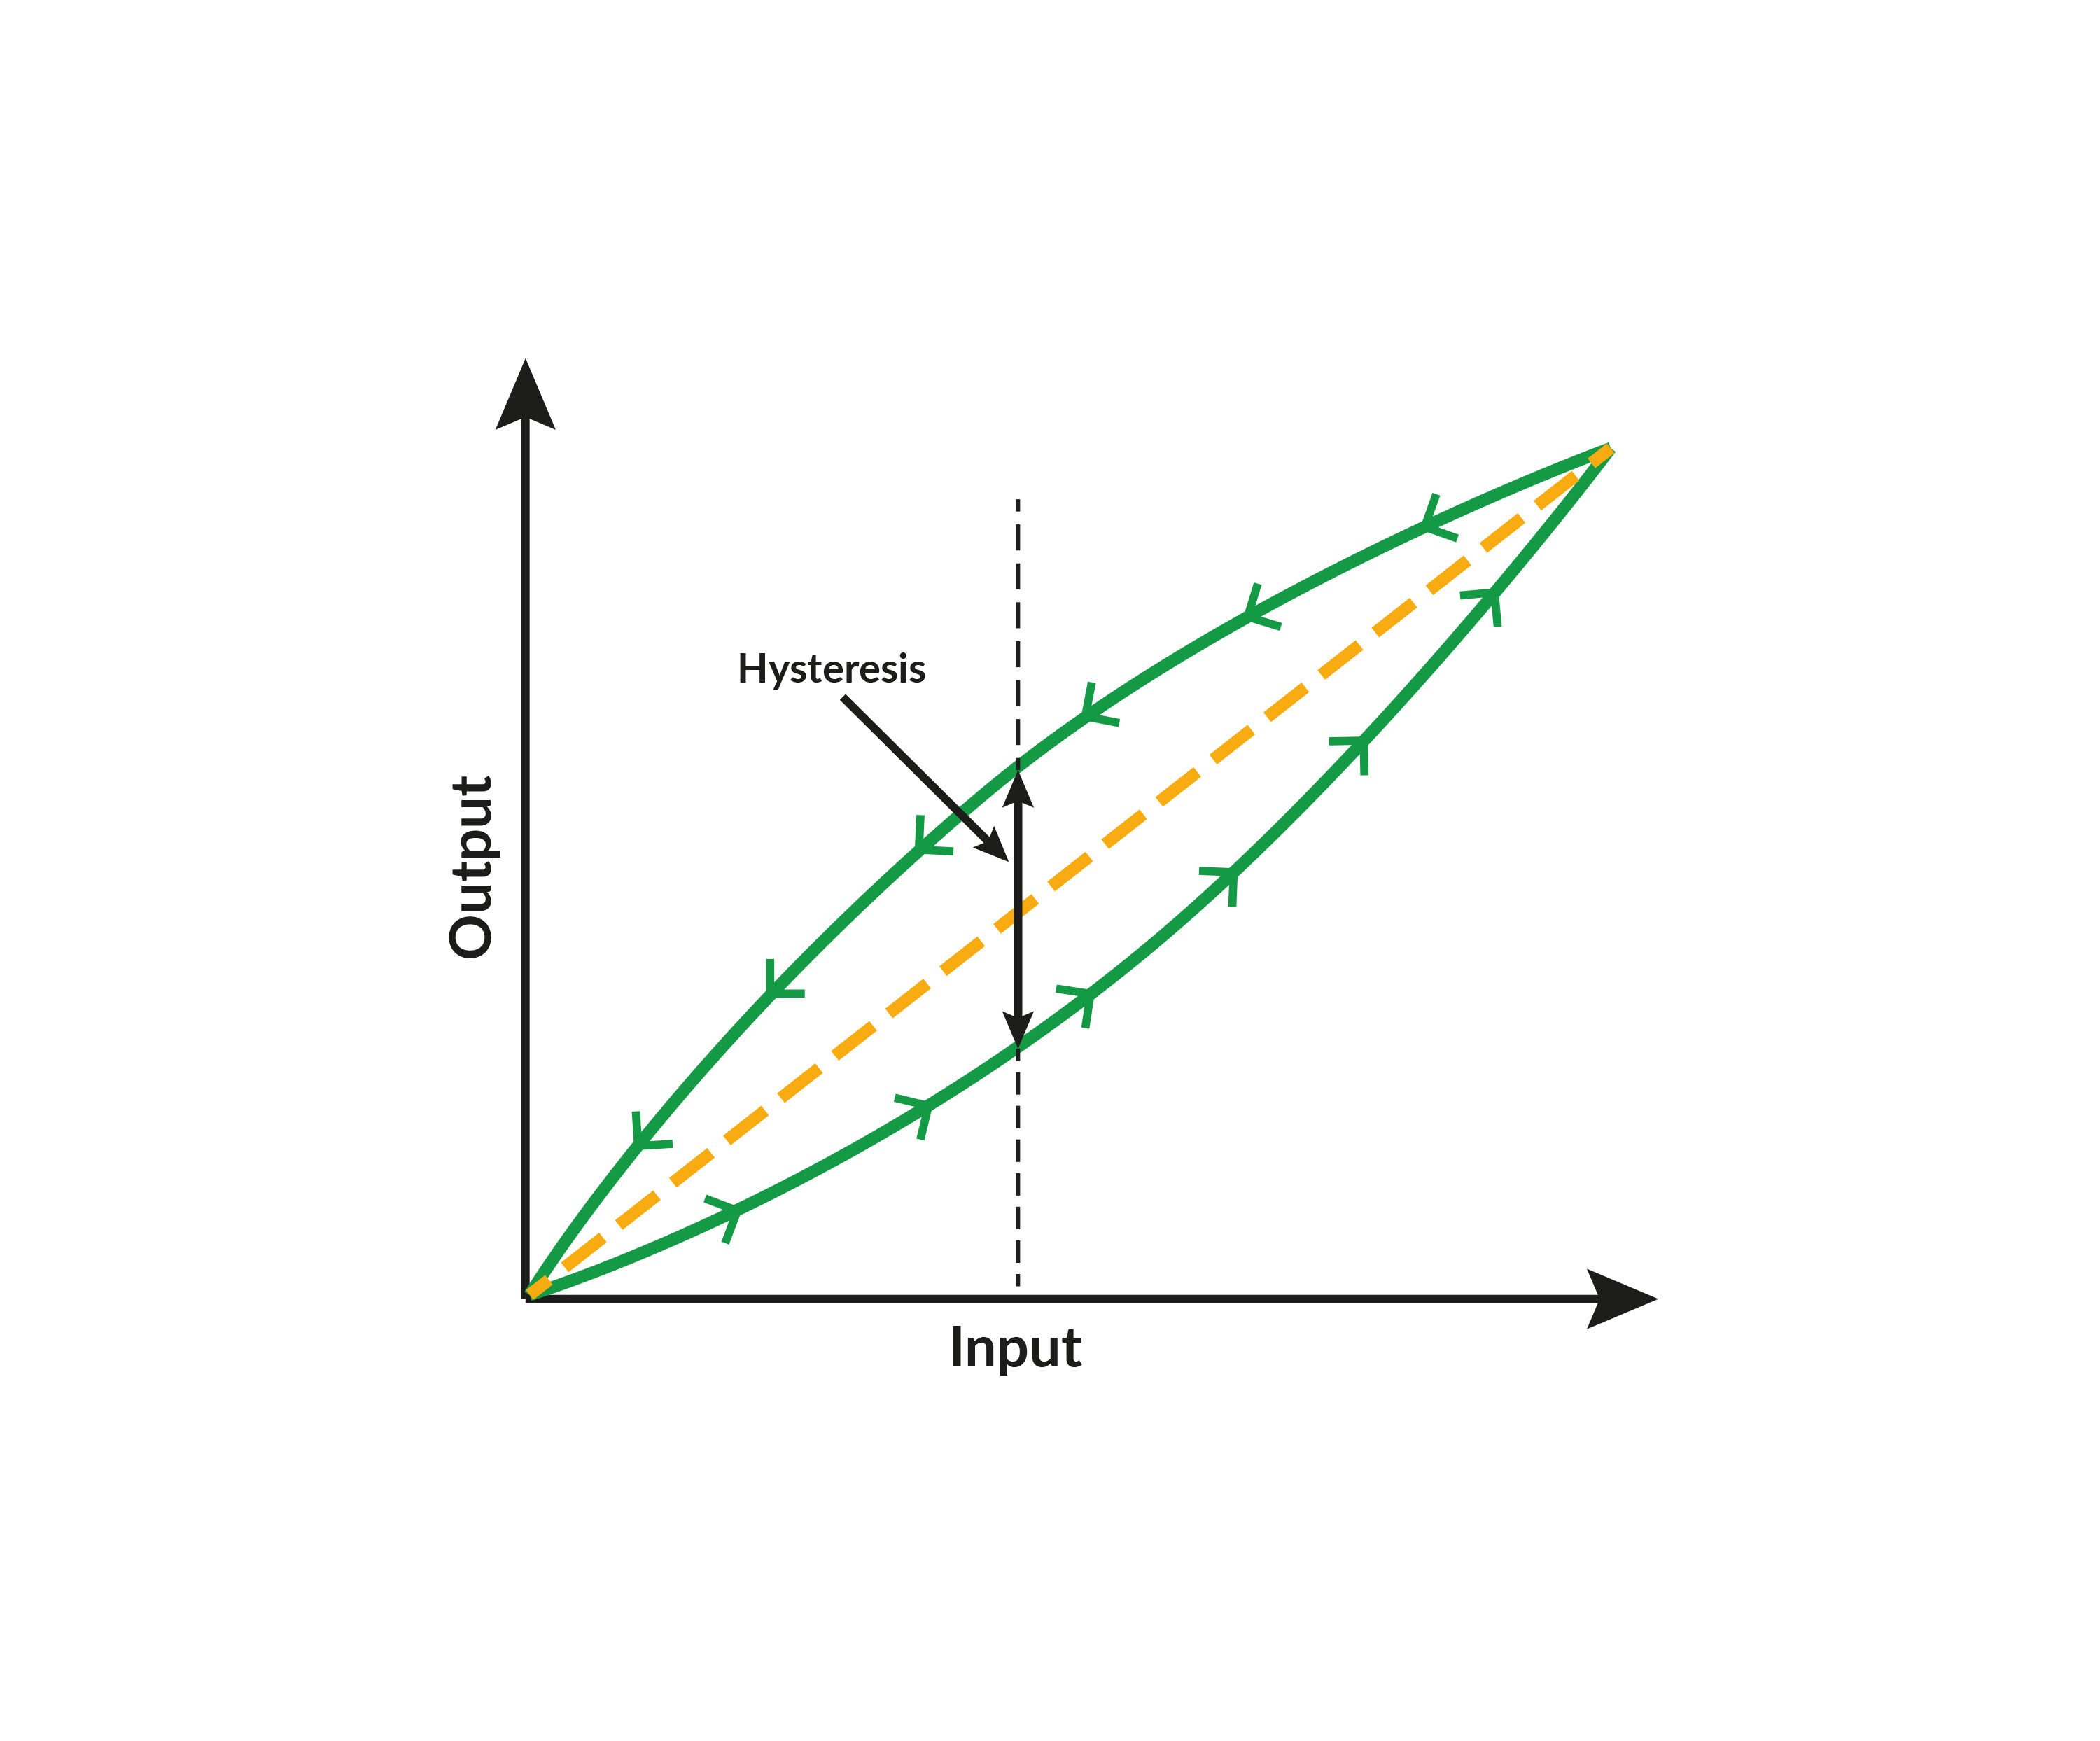
Hysteresis in pressure calibration: What you need to know
Pressure calibration is crucial for ensuring the accuracy and reliability of process instruments ...

Apr 03, 2024
With empathy to excellence - The secret to great customer service
Empathy is an essential element of great customer service. Along with understanding, it’s the most ...

Feb 13, 2024
Calibrating for a Cleaner Future - Unlocking the Potential of Waste to Energy
Waste-to-Energy (WtE) has been around since the first waste incinerator was built in 1874, but the ...

Jan 09, 2024
How an accurate, reliable calibration solution could supercharge your business [Podcast]
Whether you work in manufacturing, pharmaceuticals, healthcare, or any other field that relies on ...
Dec 12, 2023
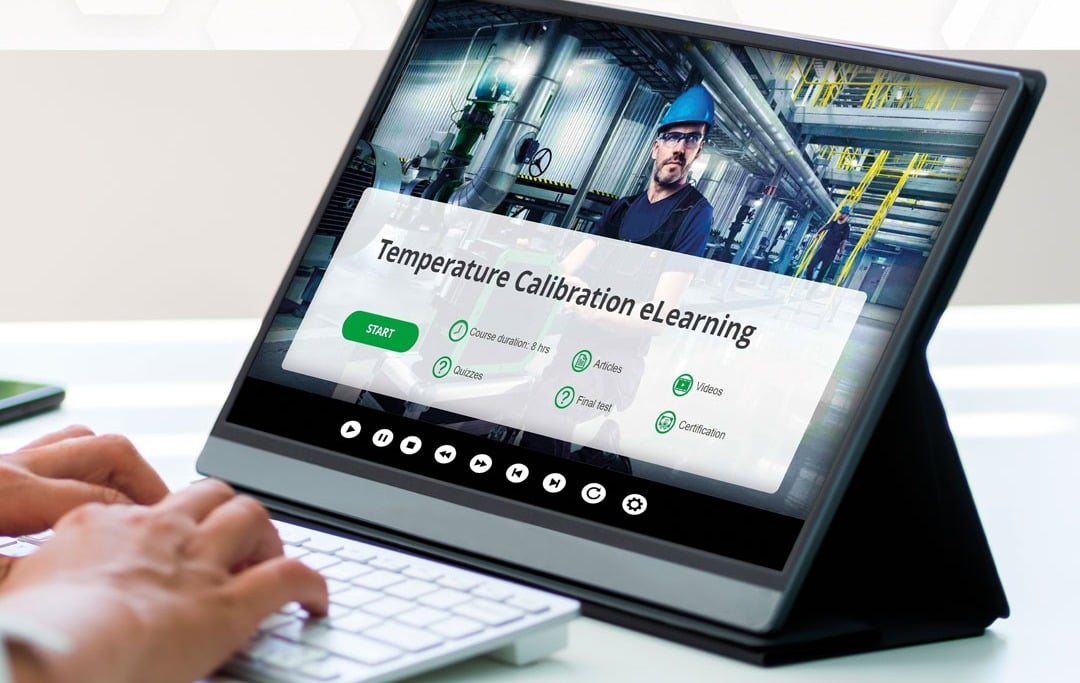
Temperature Calibration Training Course [eLearning]
In this blog post, we want to share a new way to learn more about industrial temperature ...
Nov 29, 2023
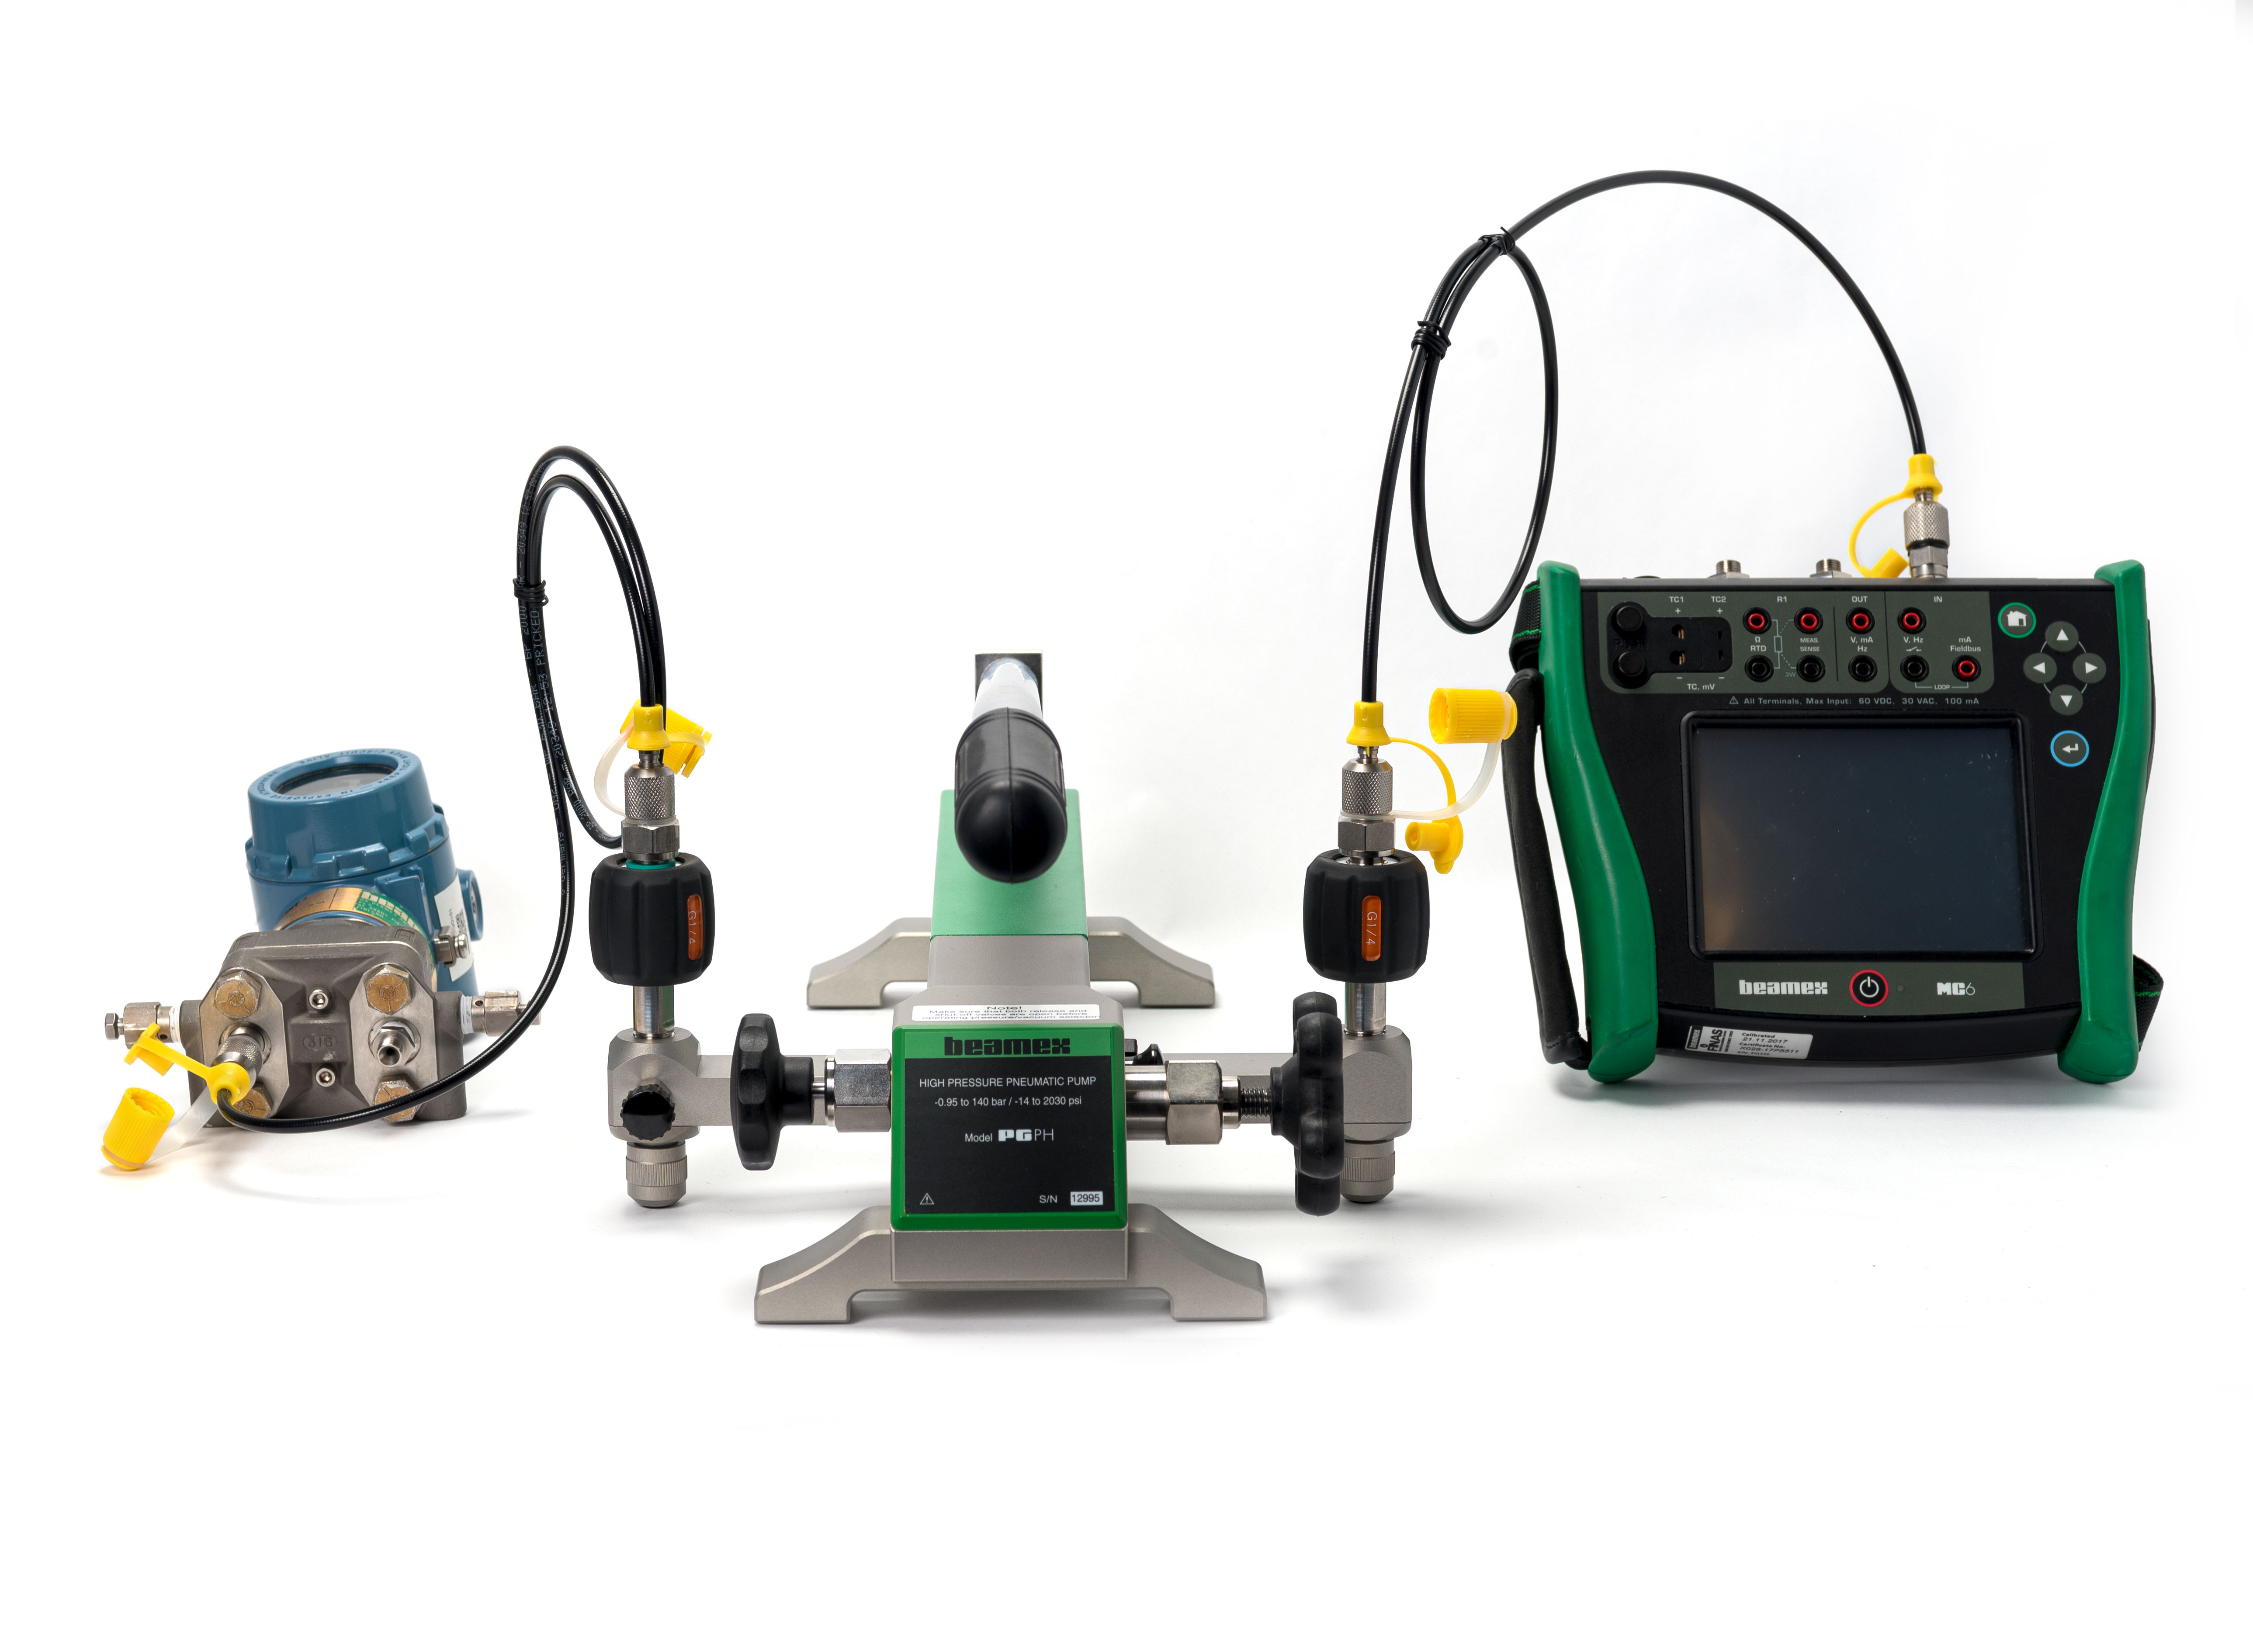
What is the adiabatic process?
Is it a leak? - Understanding the adiabatic process in pressure calibration The adiabatic process ...

Aug 08, 2023
How Douglas Calibration Services reduces technicians’ workload and stress [Case Story]
Beamex LOGiCAL Calibration Management Software has helped Douglas Calibration Services improve ...
Jul 04, 2023
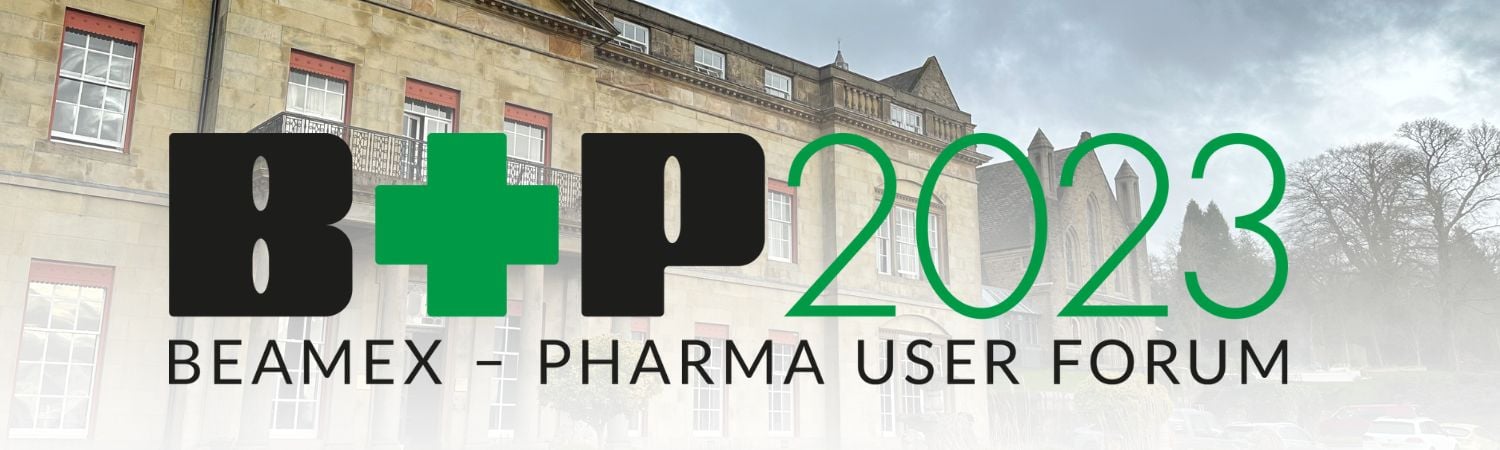
Partnering in calibration excellence at the Beamex Pharma User Forum
The biggest issues facing industry leaders from some of the largest pharma companies worldwide, ...
Jun 15, 2023
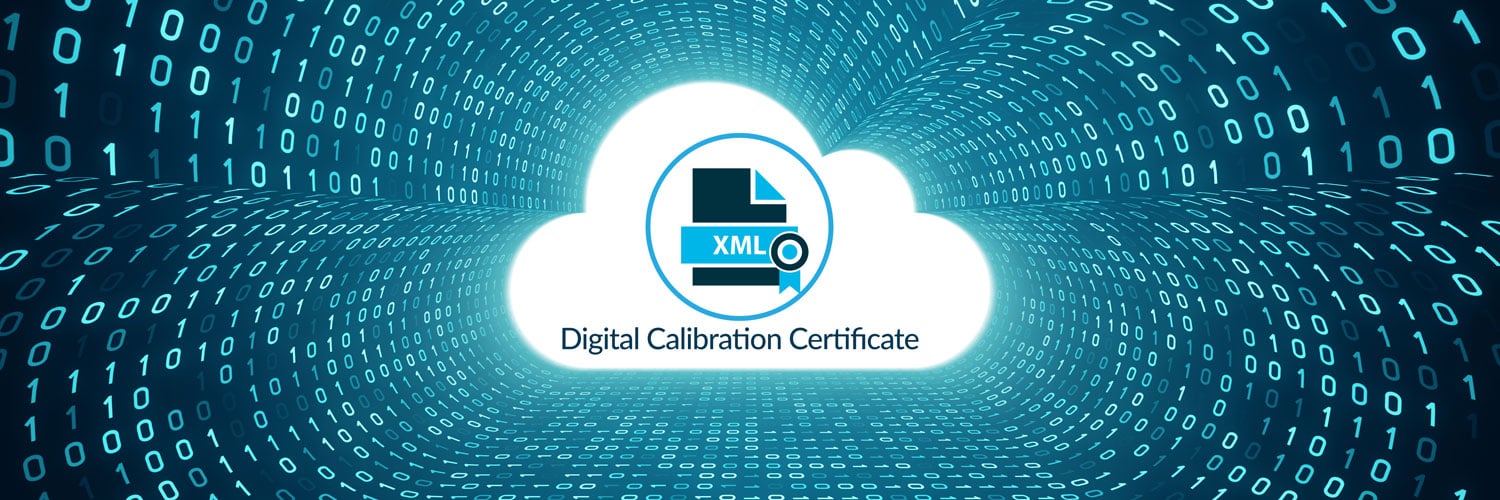
Digital Calibration Certificate (DCC) – What is it and why should you care?
The digitalization of metrology has been slower than in many other fields, and calibration ...

Apr 26, 2023
CMMS calibration module or dedicated calibration software?
When your computerized maintenance management system (CMMS) already has a calibration module, why ...

Feb 13, 2023
The most common calibration-related FDA warnings to pharma companies
As consumers of the products from pharmaceutical companies, we all want to be sure that we can ...

Oct 19, 2022
Working workshop wonders with Endress+Hauser [Case Story]
A customized Beamex solution including hardware and software sits at the heart of Endress+Hauser’s ...
Sep 22, 2022
Ensuring sustainable management of process safety for chemicals
In the chemicals industry, safety is priority number one. But how do you ensure safety in a ...

Aug 31, 2022
What does operational excellence mean? How calibration can help to improve?
In this article, we’re going to take a closer look at a topic that’s talked about a lot but isn’t ...

Jul 06, 2022
How automated calibration can help service companies be more competitive
Service companies that perform calibrations for the process industries operate in a challenging ...

May 30, 2022
Stepping on the gas with the UK’s National Grid[Case Story]
Beamex’s automated, paperless calibration solution has helped National Grid streamline its ...
Apr 25, 2022
Calibration Management and Software [eBook].
In this blog post, we want to share with you an education eBook focusing on calibration management ...
Mar 21, 2022
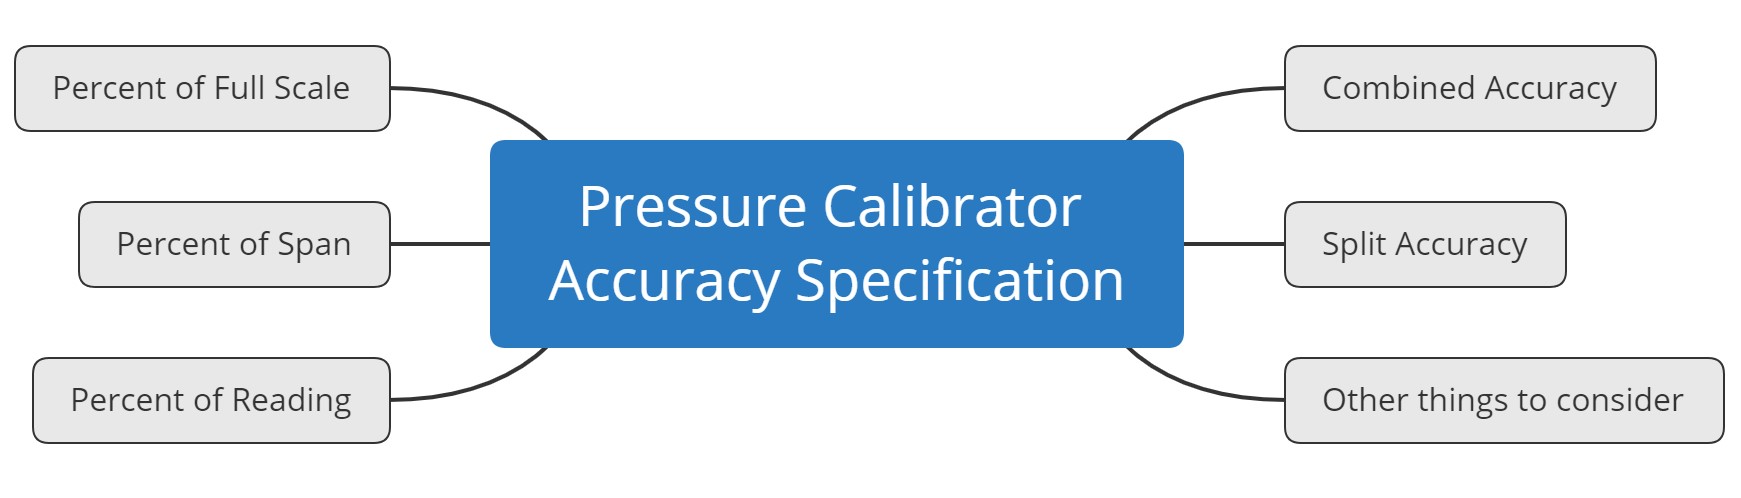
Understanding Pressure Calibrator Accuracy Specifications
Comparing the accuracy specifications of pressure calibrators can be a challenging task because ...

Feb 08, 2022
How to avoid safety and compliance issues in fine chemicals
Safety and compliance are non-negotiable in the fine chemicals industry, which produces complex, ...
Jan 11, 2022
Calibration management - transition from paper-based to digital
A Tale of Three Steves Stephen Jerge, Calibration Supervisor for Lonza Biologics, a multinational ...
.png)
Dec 01, 2021
Automating the calibration management ecosystem
It’s time to say goodbye to error-prone paper-based calibration! While the pen might be mightier ...

Oct 05, 2021
Improving efficiency and ensuring compliance in the pharmaceutical industry
Today, it seems like everyone is talking about digitalization – and for good reason. Done properly, ...
Jun 22, 2021
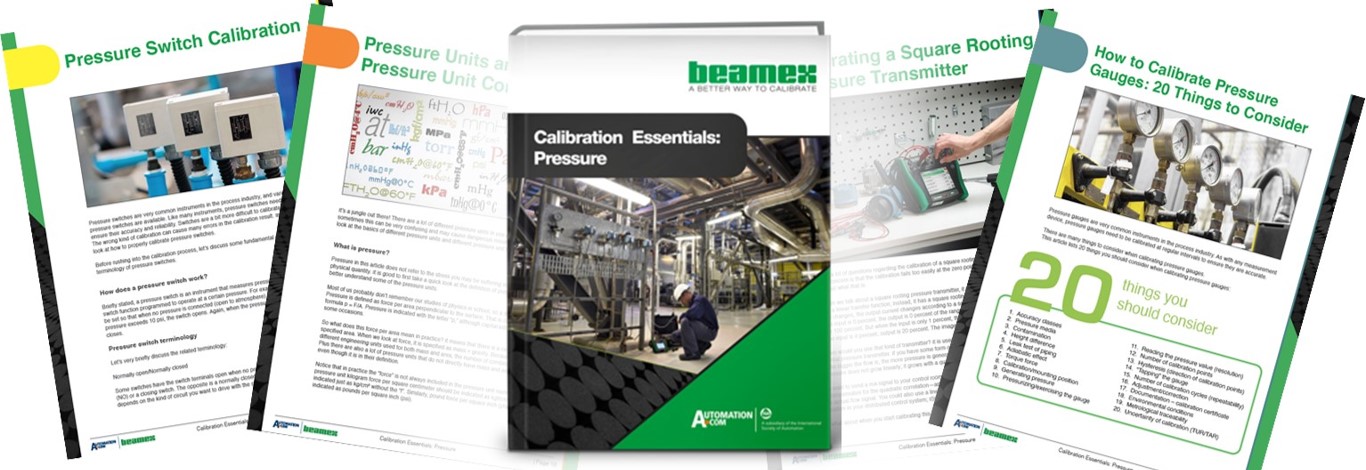
Pressure Calibration [eBook]
In this blog post, we want to share a free educational eBook on Pressure Calibration and other ...
May 20, 2021
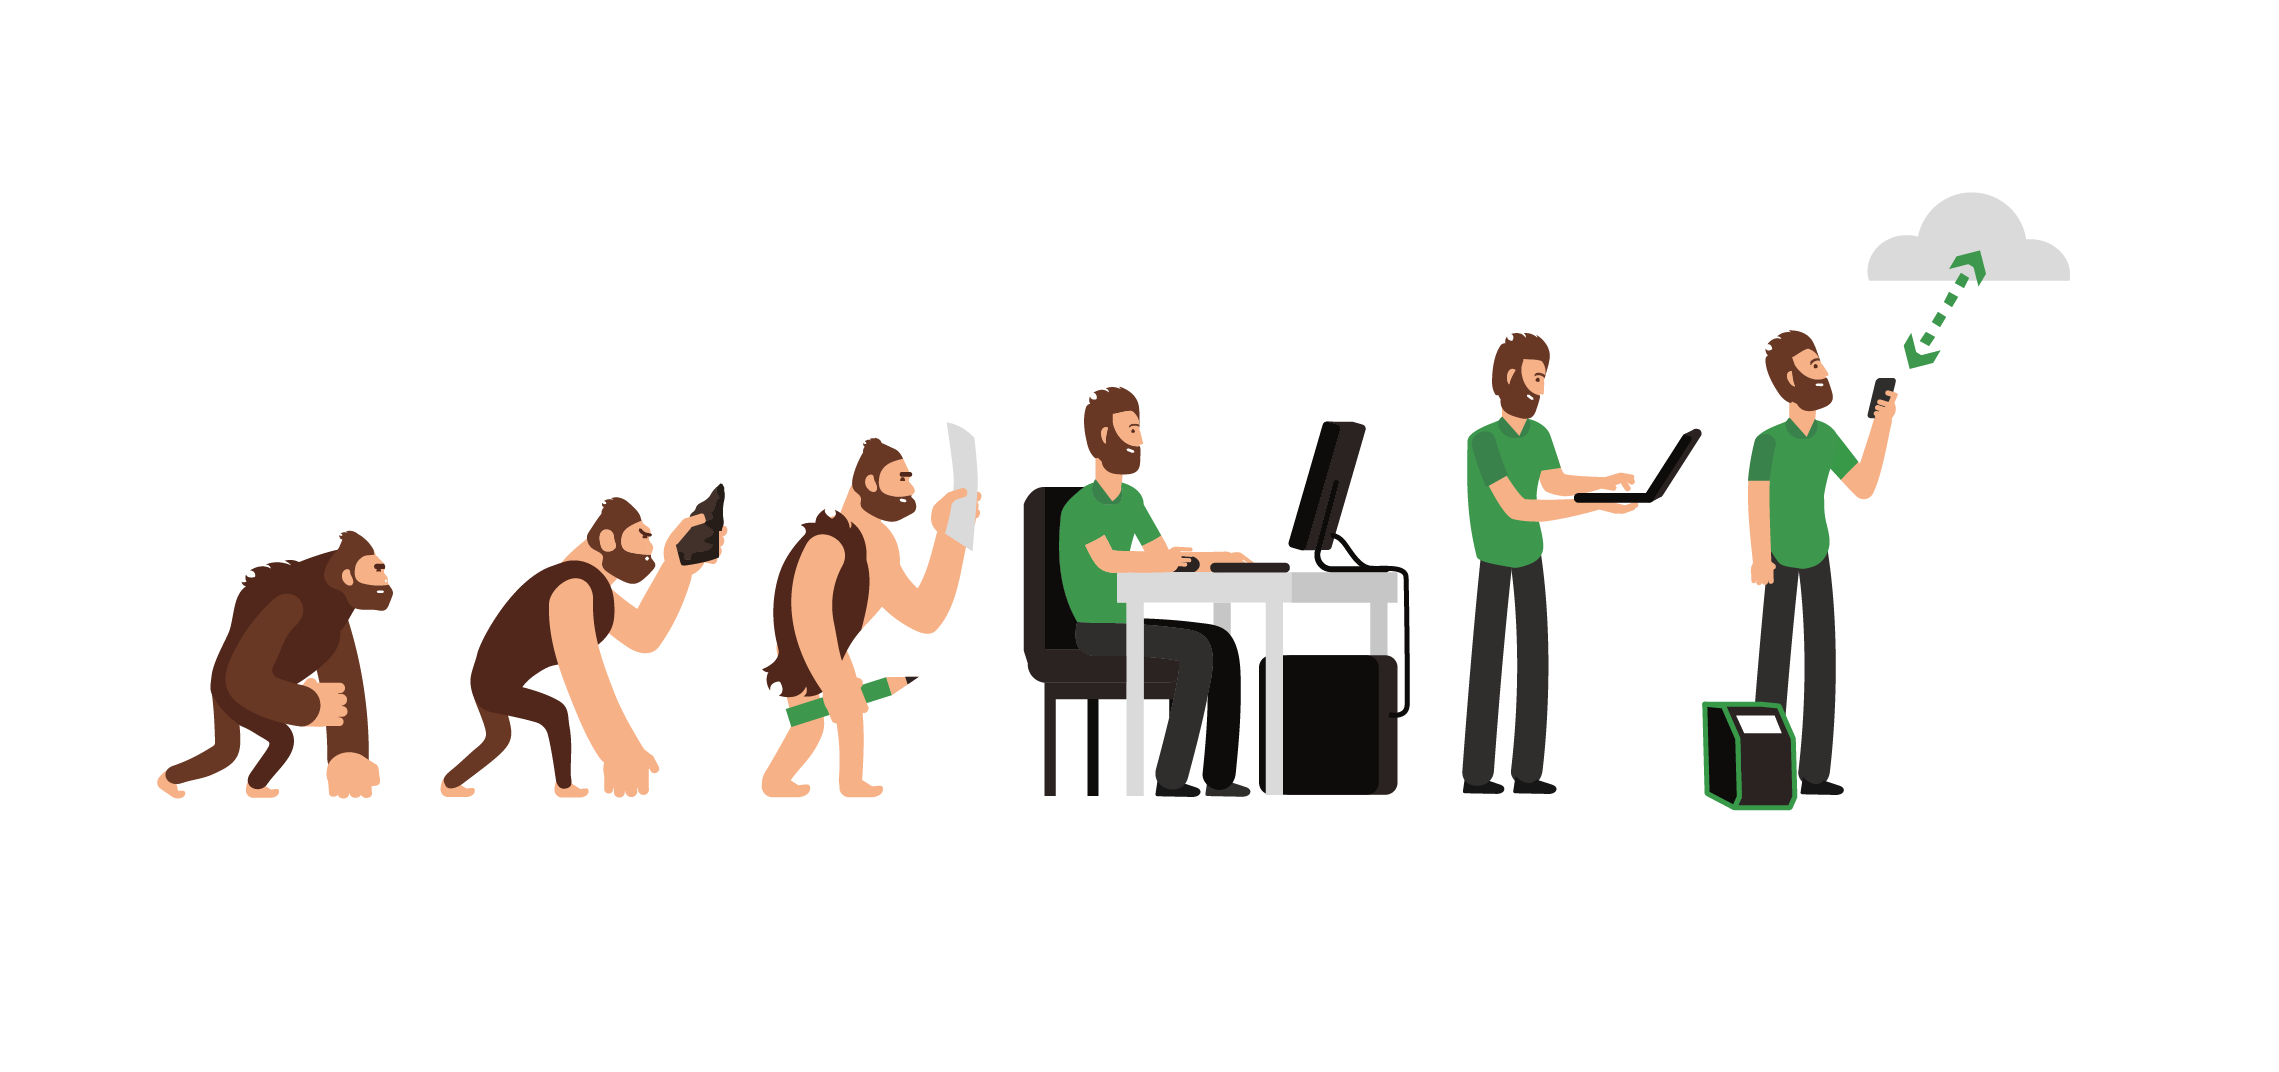
The Evolution of Calibration Documentation
Our modern history is defined by the advent of writing. Writing is humankind’s principal technology ...
Mar 25, 2021
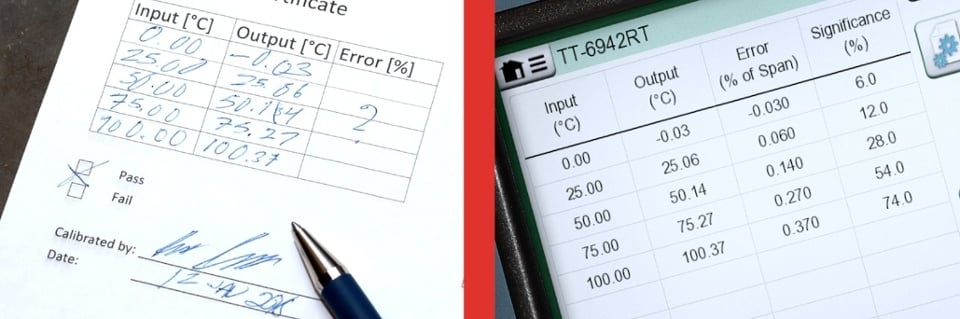
Manual Data Entry Errors
Many businesses still use a lot of manual entry in their industrial processes. This is despite the ...
Feb 23, 2021
How to choose a calibration laboratory - 13 things to consider
So you have invested in some new, accurate calibration equipment. Great! But as with many other ...
Dec 02, 2020
How to calibrate a temperature switch
Temperature switches are commonly used in various industrial applications to control specific ...
.png)
Oct 22, 2020
CMMS and calibration management integration - Bridging the gap
Recently, Patrick Zhao, Corporate Instrument & Analyzer SME for Braskem America, spoke at the ...
Sep 23, 2020
Temperature Calibration Webinars
We have recently done two webinars on temperature calibration; one was done by Beamex, Inc. in USA ...

Aug 11, 2020
Sustainability in Energy from Waste
Waste not, want not; a phrase coined to denote resourcefulness, the idea of utilising what we have ...
Jun 23, 2020
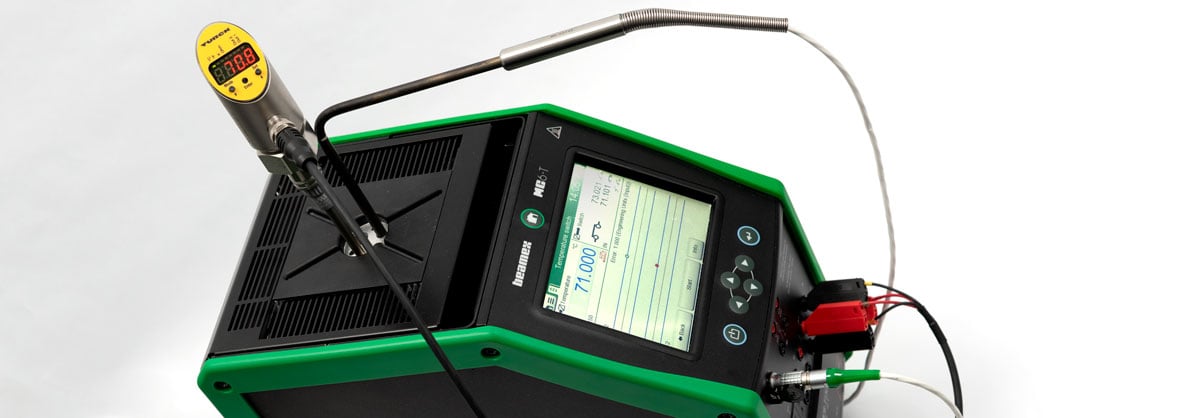
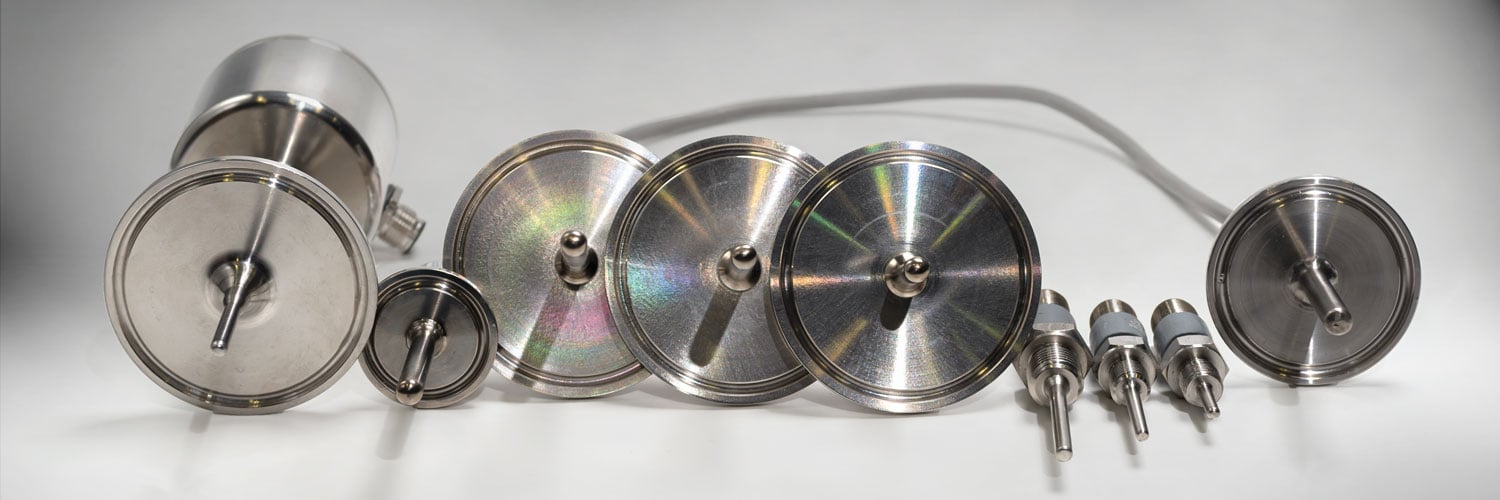
Sanitary temperature sensor calibration
Sanitary temperature sensors are commonly used in many industries, such as Food and Beverage, ...
May 07, 2020
Future calibration trends by calibration experts in the pharmaceutical industry
We regularly organize user group meetings for our pharmaceutical customers. During a recent ...
Mar 30, 2020
Pressure Switch Calibration
Pressure switches are very common instruments in the process industry, and various kinds of ...
Feb 19, 2020
Temperature Calibration [eBook]
In this blog post we want to share with you an educational eBook focusing on temperature ...
Jan 23, 2020
Calibration Trends Featuring Automation & Digitalization [Webinar]
In this blog post, I am proud to share a recent webinar collaboration with ISA (International ...
Dec 03, 2019
Pressure Transmitter Accuracy Specifications – the small print
Pressure transmitters are widely used in the process industry. The advertised accuracy ...

Oct 07, 2019
How calibration improves plant sustainability
You only live once: A common phrase used around the world to indicate how one should live their ...
Aug 27, 2019
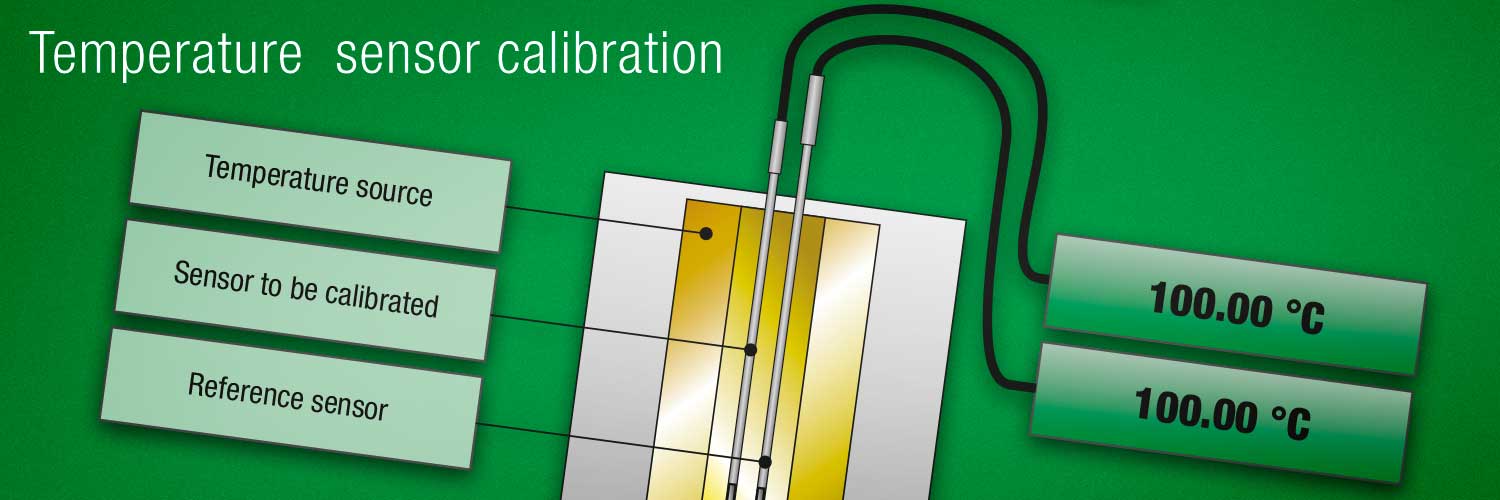
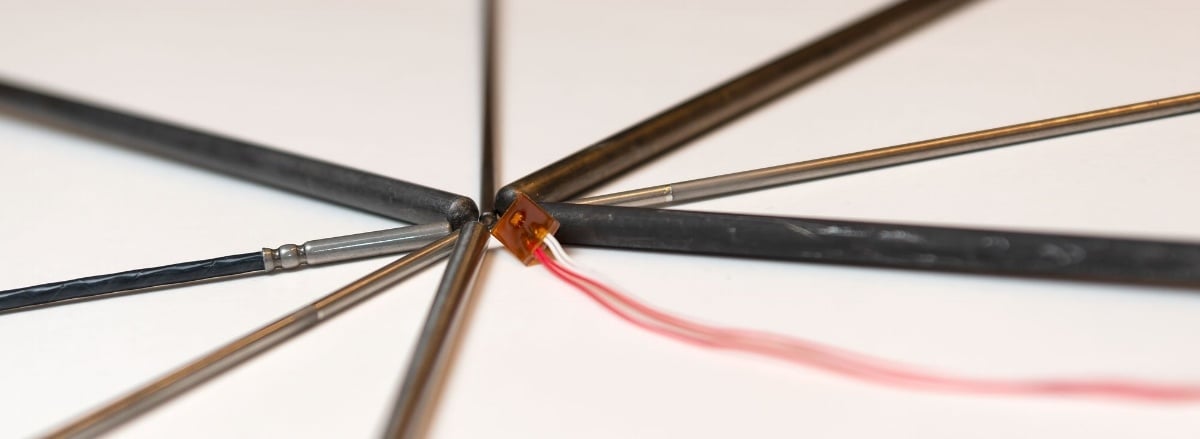
How to calibrate temperature sensors
Temperature measurement is one of the most common measurements in the process industry. Every ...
Jul 24, 2019
Why use calibration software?
The shortest answer is to automate documentation to save time, lower risks, and quickly analyze ...
Jun 27, 2019
Calibration uncertainty and why technicians need to understand it [Webinar]
In this blog post, I want to share a webinar titled "Calibration uncertainty and why technicians ...

May 14, 2019
How a business analyst connected calibration and asset management [Case Story]
How one of America’s largest public power utilities integrated its asset management software with ...
Apr 24, 2019
Optimal Calibration Parameters for Process Instrumentation
Many calibration technicians follow long-established procedures at their facility that have not ...
Feb 22, 2019
Weighing Scale Calibration Video
In this post we share an educational video on how to calibrate weighing scales. The video goes ...

Jan 11, 2019
Calibration in Times of Digitalization - a new era of production
This is the first blog post in the Beamex blog series "Calibration in Times of Digitalization" we ...
Nov 19, 2018
Do more with less and generate ROI with an Integrated Calibration Solution
Process instrument calibration is just one of the many maintenance related activities in a process ...
Oct 18, 2018
How to calibrate temperature instruments [Webinar]
In this blog post, I will share with you a two-part webinar series titled “How to calibrate ...
Aug 23, 2018
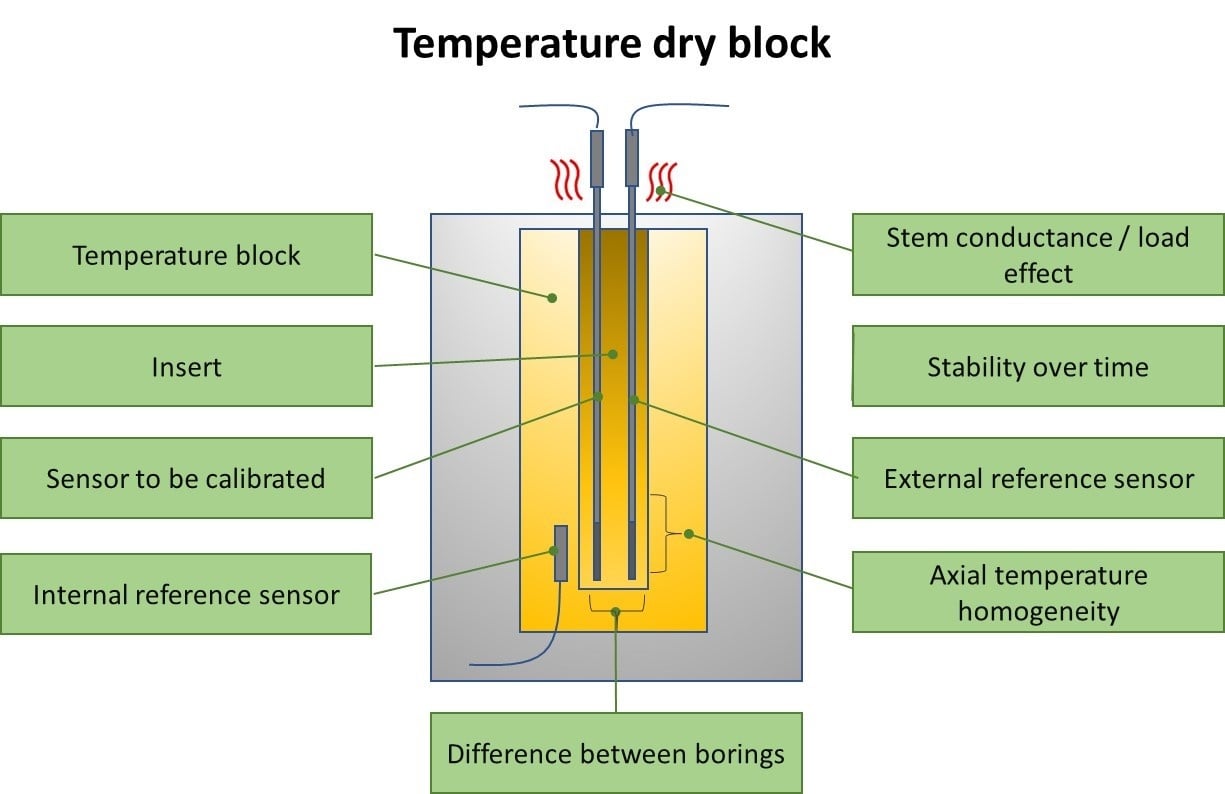
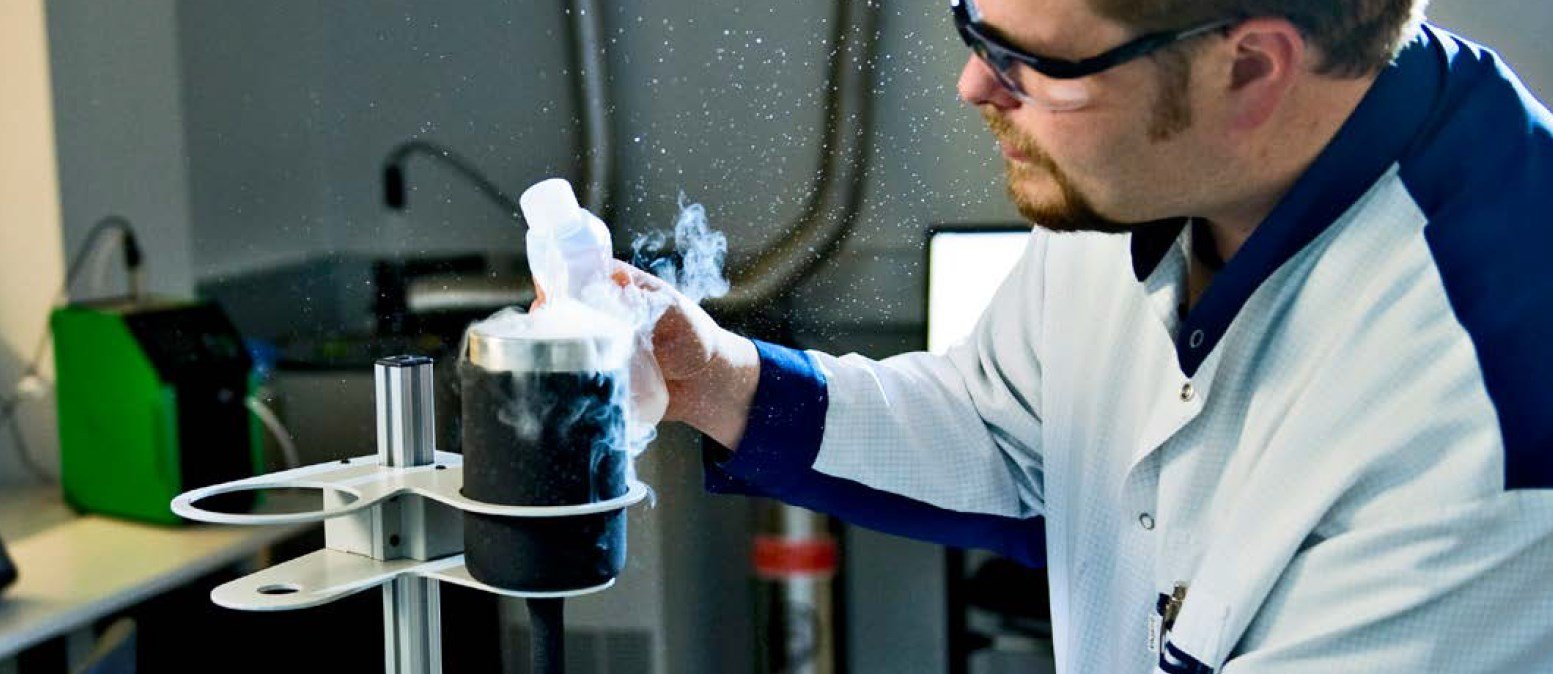
Uncertainty components of a temperature calibration using a dry block
In some earlier blog posts, I have discussed temperature calibration and calibration uncertainty. ...
Jun 20, 2018
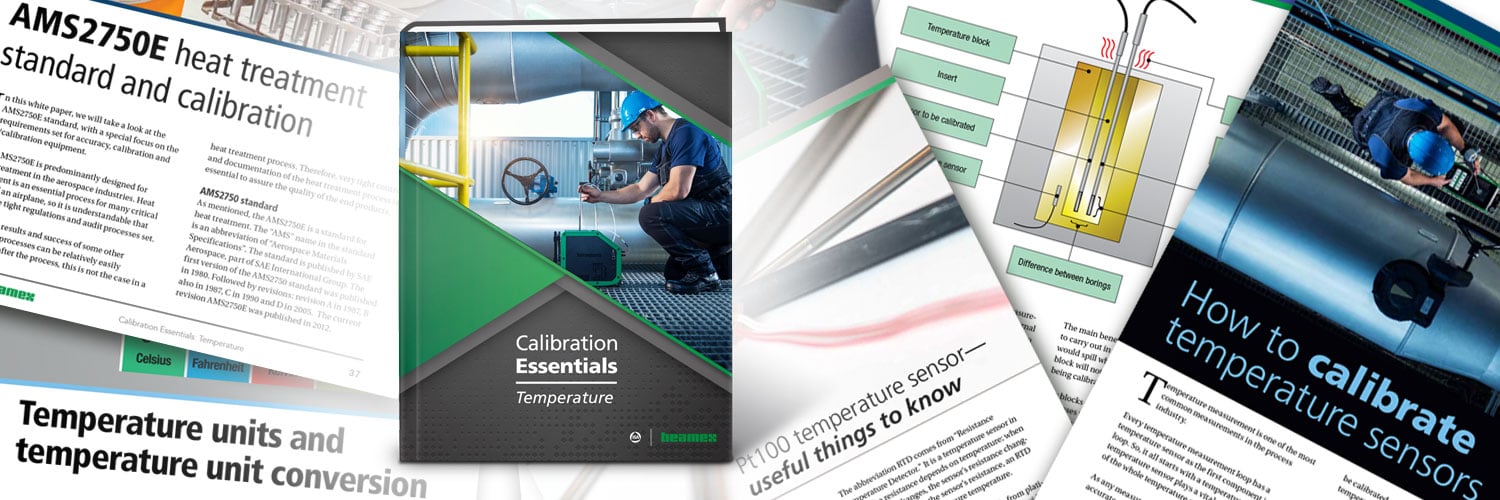
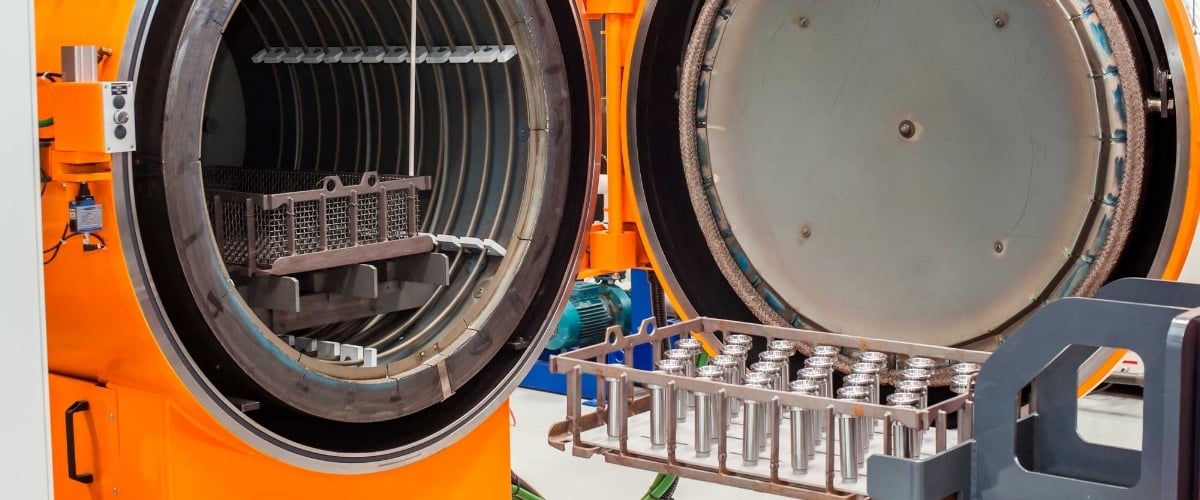
AMS2750E Heat Treatment Standard and Calibration
Update (2025): This article was originally written when AMS2750 revision E was current. The ...

May 30, 2018
Using Metrology Fundamentals in Calibration to Drive Long-Term Value
This article discusses some critical items to address for a calibration program based on sound ...
Apr 17, 2018
Pt100 temperature sensor – useful things to know
Edit October 2023: The Tolerance (Accuracy) Classes edited per IEC 60751:2022. Edit November 2025: ...
Mar 20, 2018
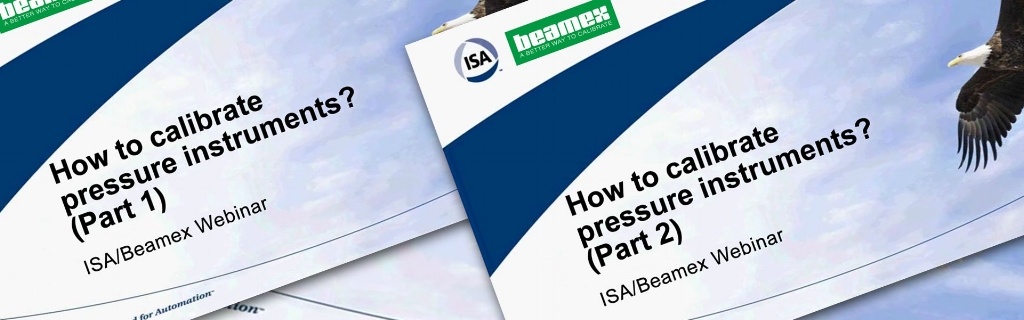
How to calibrate pressure instruments [Webinar]
In this blog post, I want to share with you a two-part webinar series titled “How to calibrate ...

Feb 27, 2018
Common Data Integrity Pitfalls in Calibration Processes
In this blog post, I will discuss the most common data integrity pitfalls in the calibration ...
Jan 30, 2018
How often should instruments be calibrated? [Update]
How often should instruments be calibrated? That is a question we get asked often. It would be nice ...
Dec 20, 2017
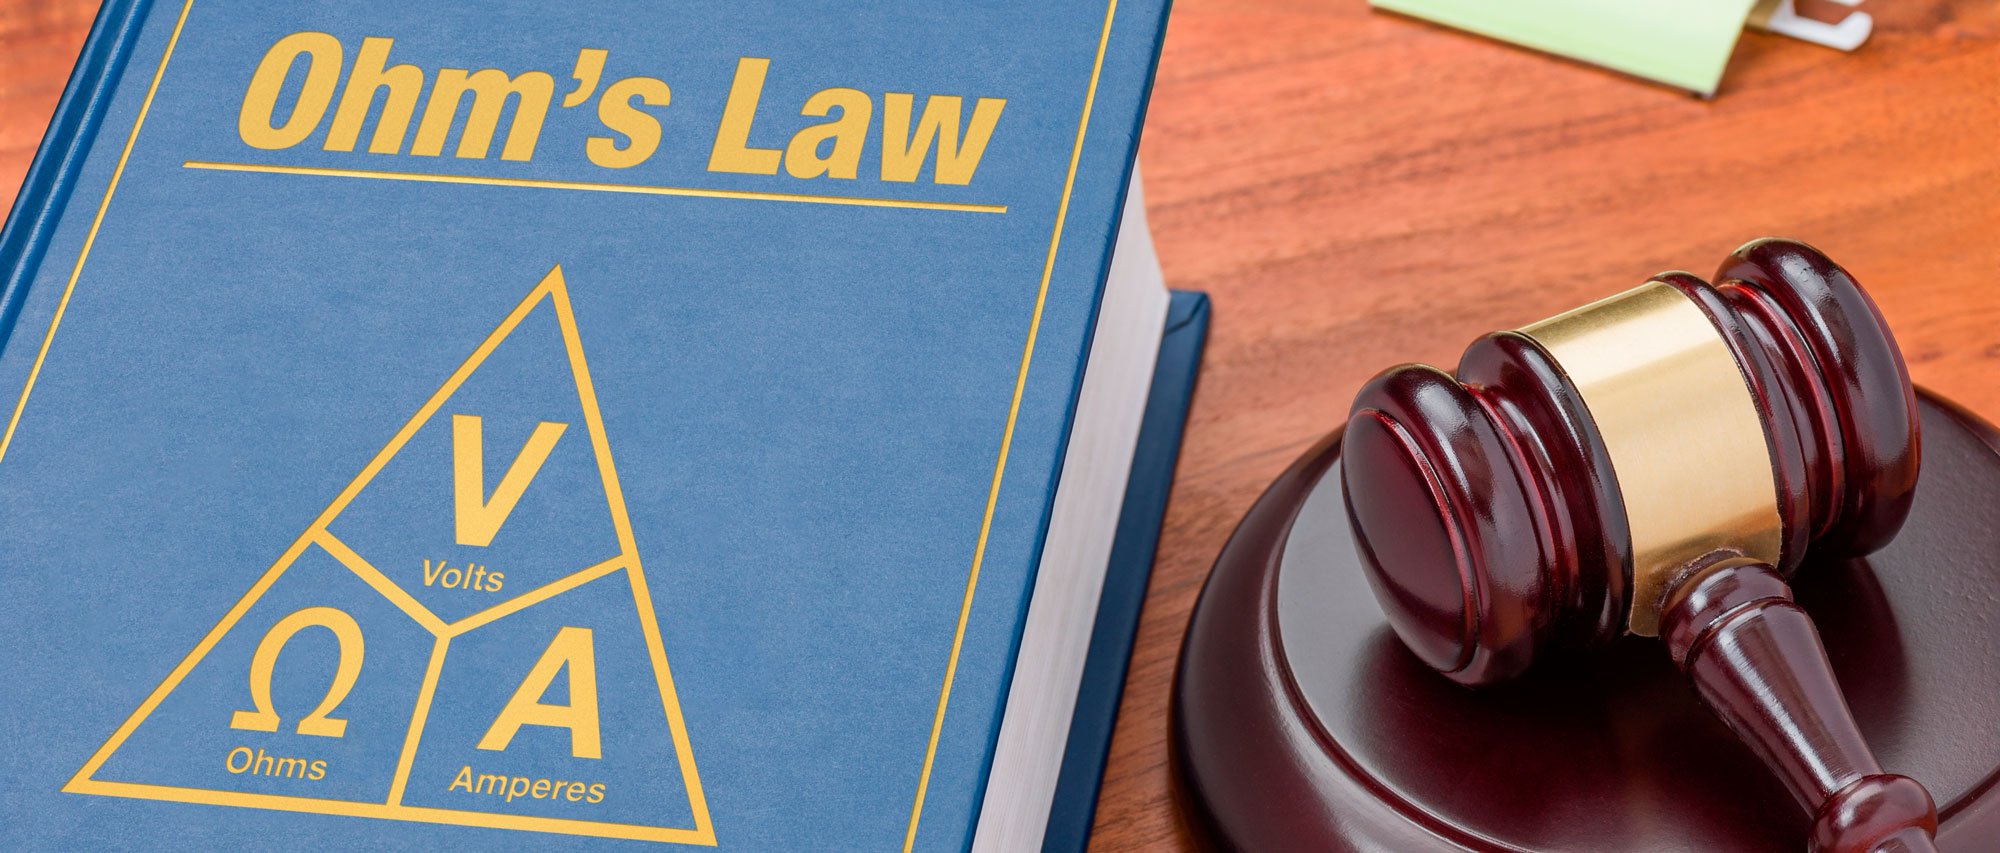
Ohm’s law – what it is and what an instrument tech should know about it
In this post, I would like to talk you about the Ohm’s law. Why? Because it is helpful in many ...
Nov 23, 2017
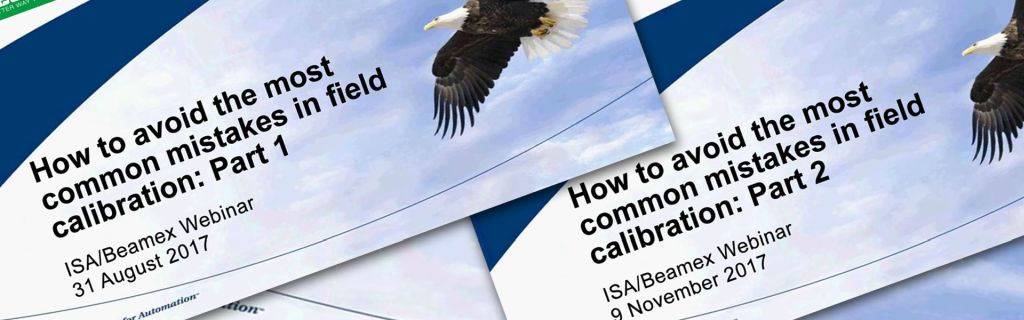
How to avoid common mistakes in field calibration [Webinar]
This post includes the recordings of the two-part webinar series titled “How to avoid the most ...

Oct 31, 2017
Calibration in a hazardous area
This post discusses calibration in hazardous area in the process industry.
Sep 19, 2017
Thermocouple Cold (Reference) Junction Compensation
In this blog post, I will take a short look on thermocouples and especially on the cold junction ...

Aug 28, 2017
Resistance measurement; 2, 3 or 4 wire connection – How does it work and which to use?
In this blog post, I explain how a resistance or RTD meter works and the difference between the 2, ...

Jul 18, 2017
What is barometric pressure?
We regularly get asked, “what is barometric pressure?” So I decided to make a short blog post to ...
Jun 13, 2017
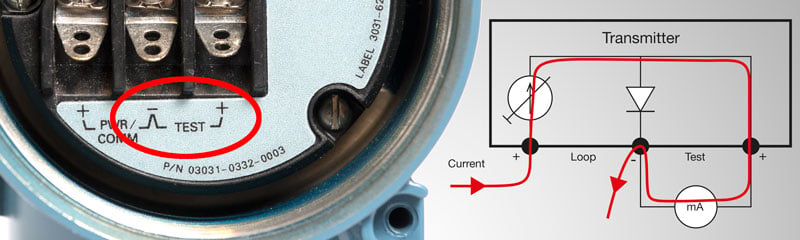
Measuring current using a transmitter’s test connection – don’t make this mistake!
If I had to summarize the content of this post into one sentence, it would be: Using a mA meter ...
May 16, 2017
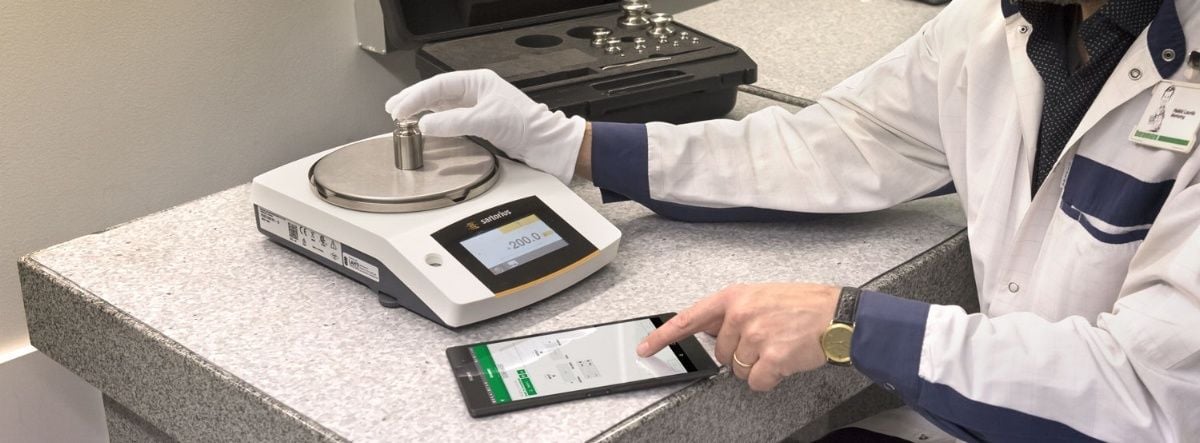
Weighing scale calibration - How to calibrate weighing instruments
In this article, I look at the practical considerations and the different tests you should perform ...
Apr 05, 2017
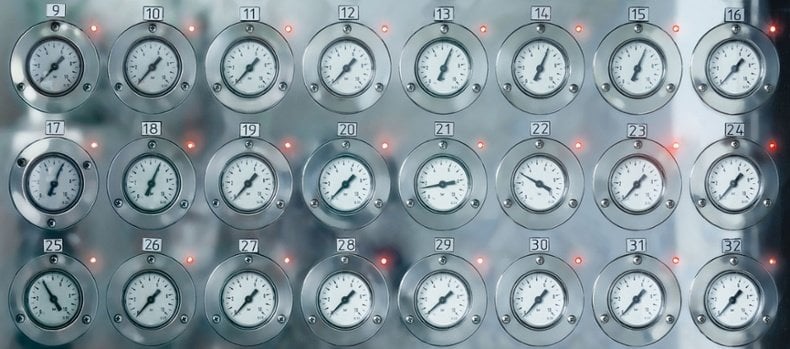
How to calibrate pressure gauges - 20 things you should consider
Pressure Gauge Calibration 20 things you should consider when calibrating pressure gauges Pressure ...
Mar 15, 2017
Data Integrity in Calibration Processes
Calibration in pharmaceutical industry What is Data Integrity? Why is it important and acute? What ...
Feb 21, 2017
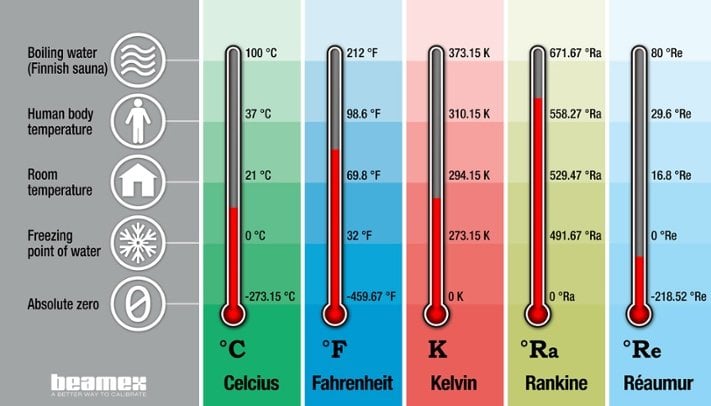
Temperature units and temperature unit conversion
Edit: The definition of kelvin has been edited after the 2019 redefinition of the SI system. In ...
Feb 08, 2017
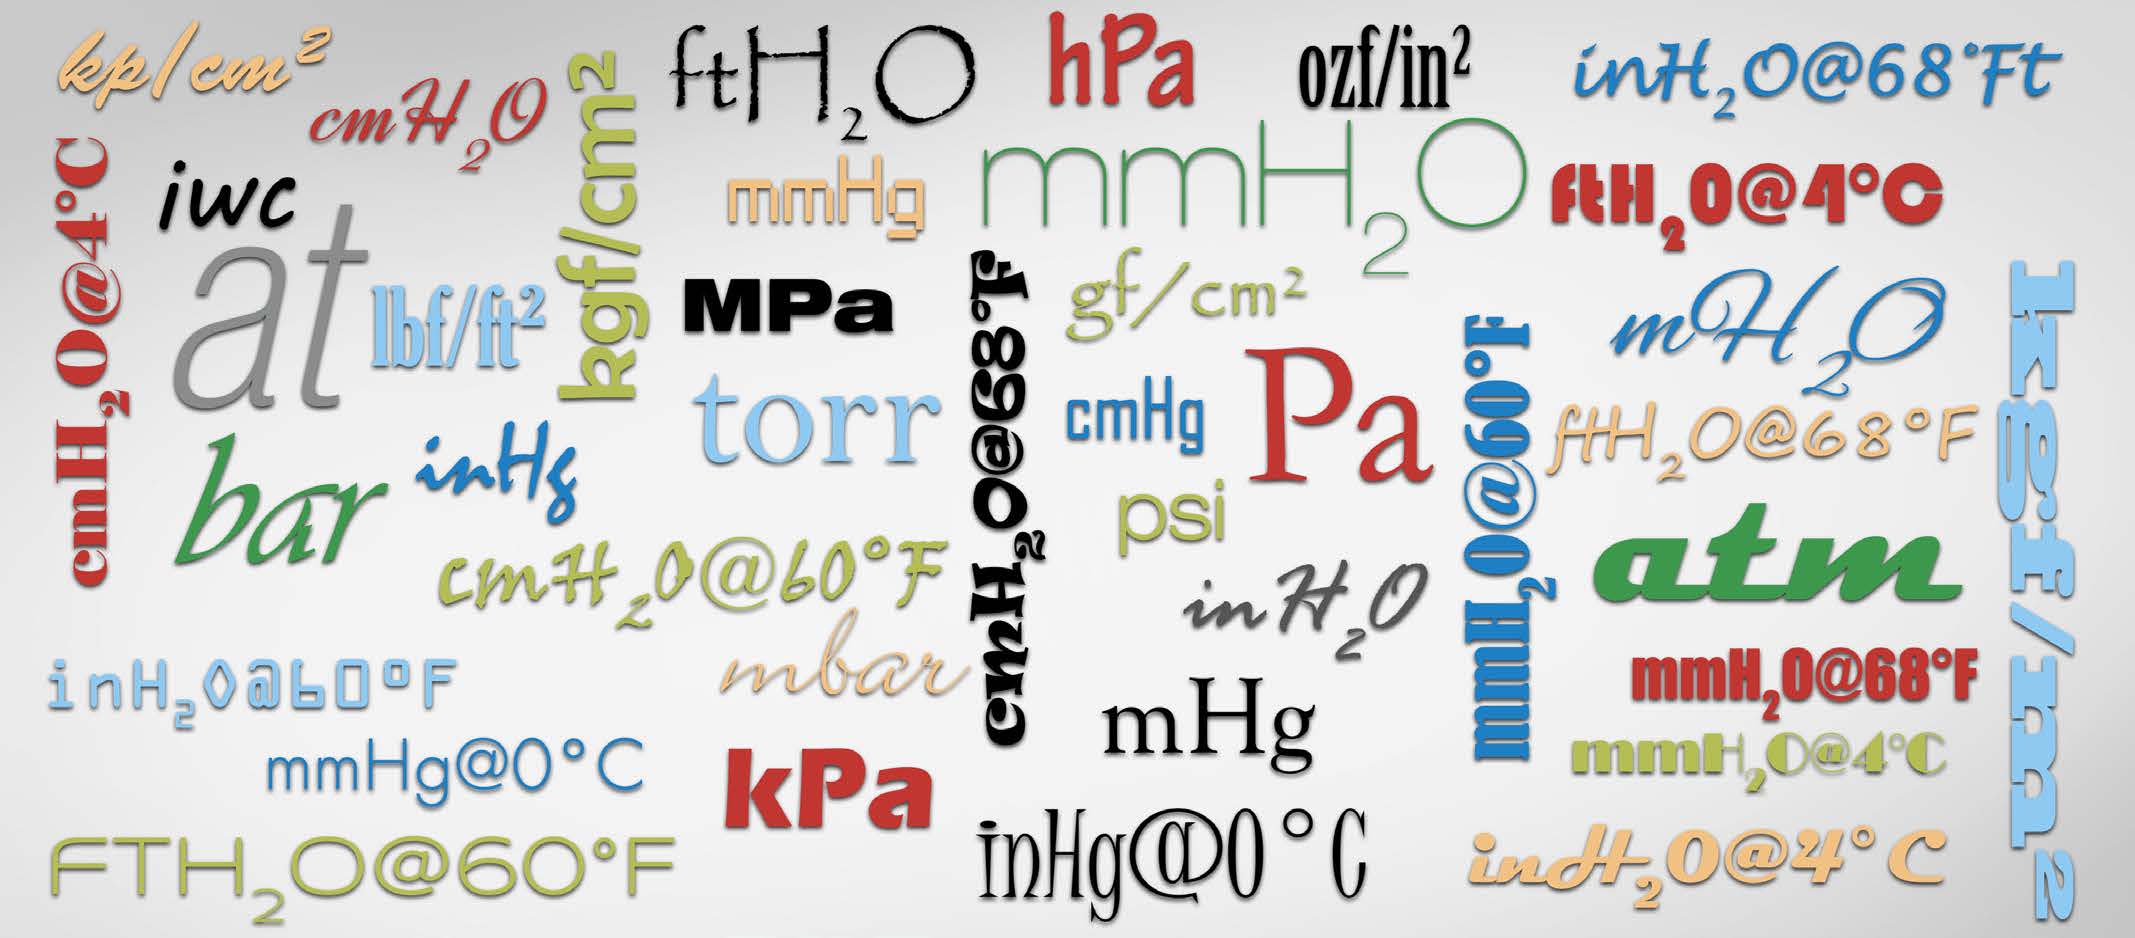
Pressure units and pressure unit conversion
It’s a jungle out there! There are a lot of different pressure units in use around the world and ...
Feb 02, 2017
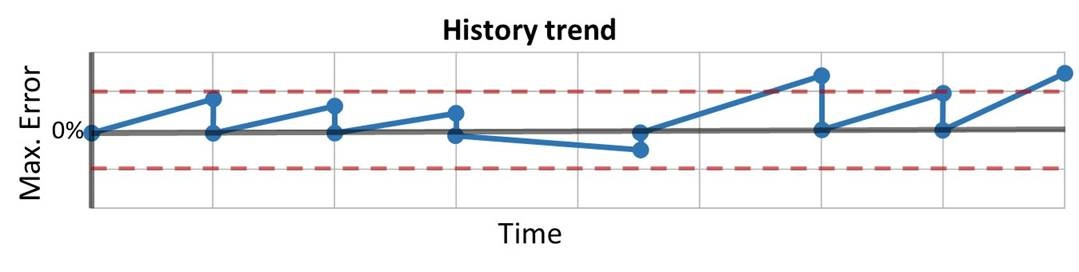
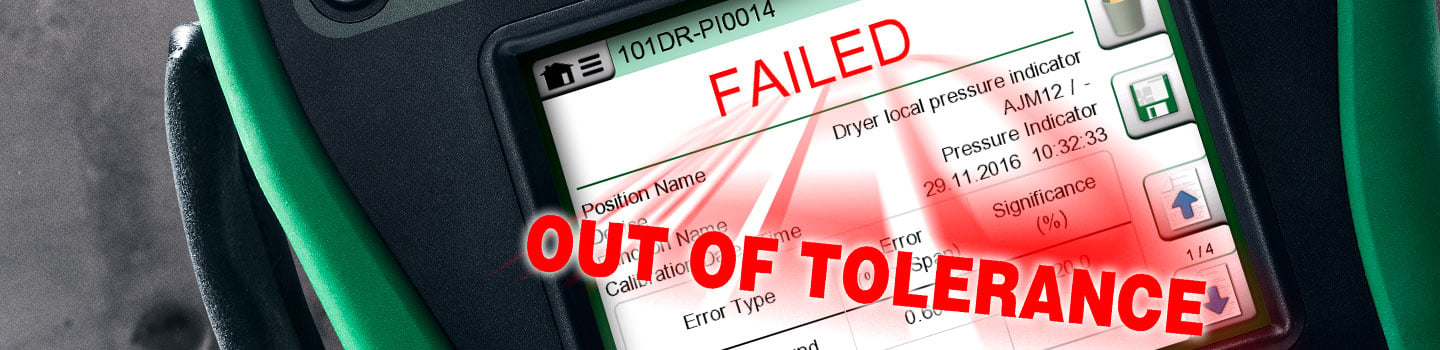
Calibration Out of Tolerance – Part 2
In this post I continue on the topic of calibration being “Out of Tolerance” (OoT) or “Failed”. ...
Jan 18, 2017
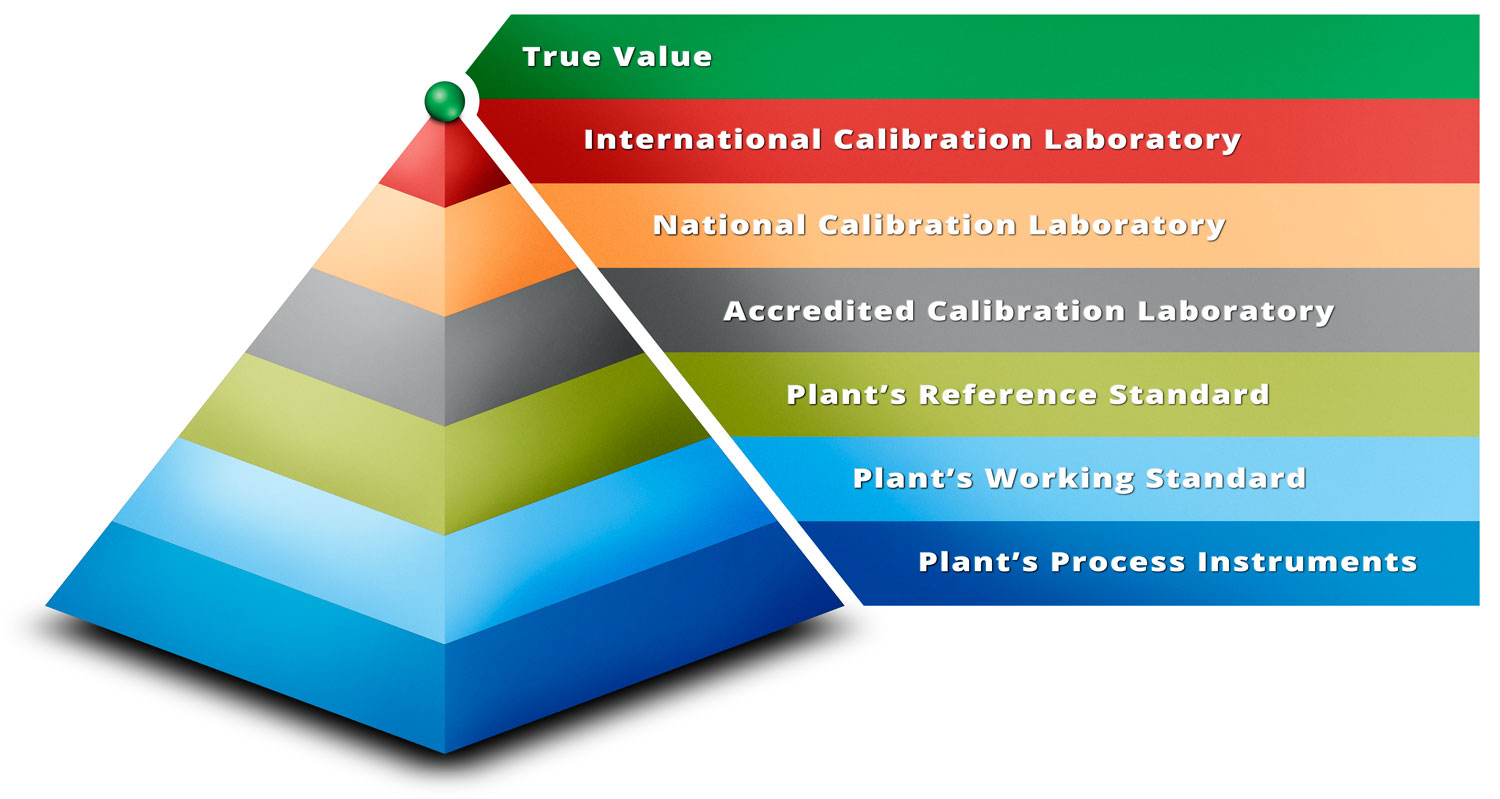
Metrological Traceability in Calibration – Are you traceable?
What is metrological traceability in calibration and how can you be traceable? In calibration, the ...
Dec 16, 2016
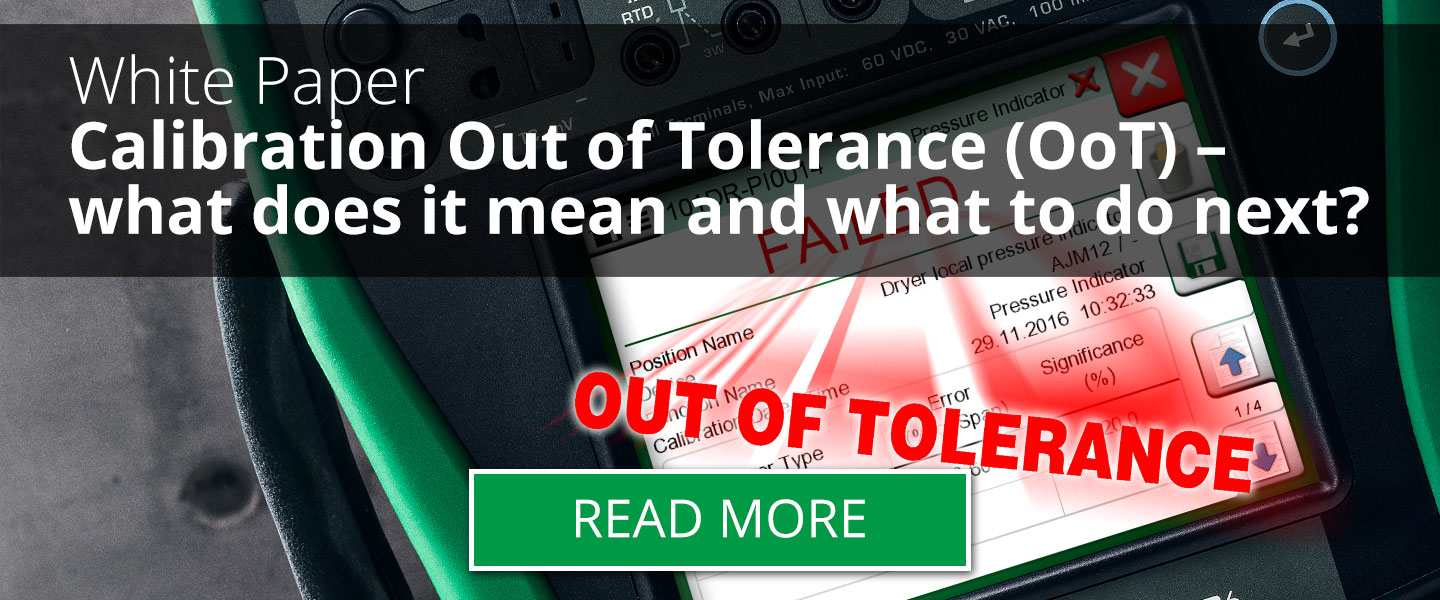
Calibration Out of Tolerance: What does it mean and what to do next? - Part 1 of 2
Calibration out of tolerance – ready to hit the Panic button? In this post we are talking about ...
Nov 18, 2016
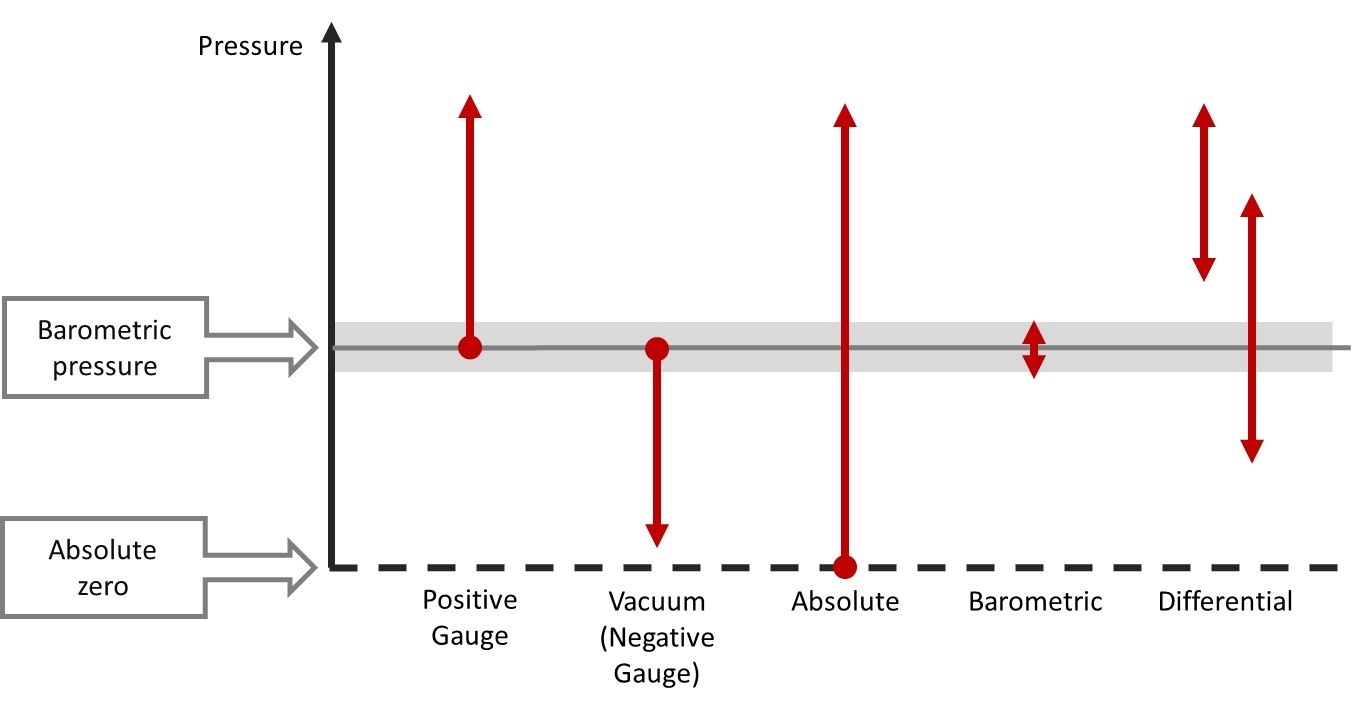
Pressure calibration basics – Pressure types
Figure 1. Pressure types On a regular basis, we receive customer questions about pressure types and ...

Nov 08, 2016
Proof Testing: Calibration By A Different Name?
The oil and Gas industry in the North Sea has been hit by a Perfect Storm – the rapid fall in the ...
Nov 02, 2016
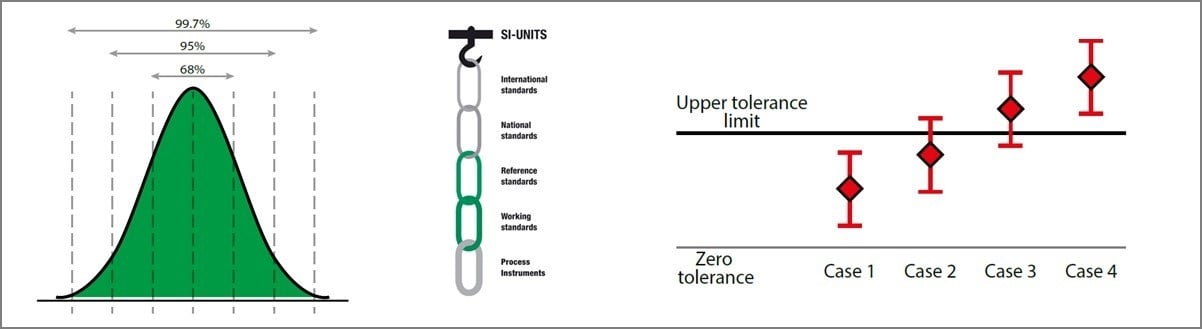
Calibration uncertainty for dummies
This article was updated on December 2, 2021. The three separate blog articles on calibration ...
Oct 28, 2016
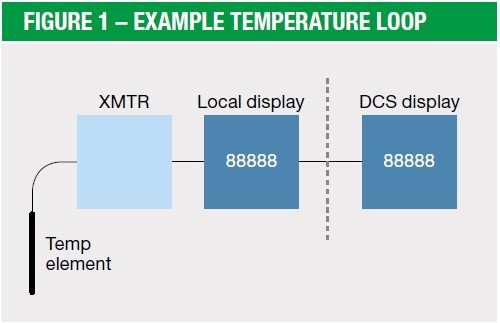
Calibration video: How to calibrate a temperature measurement loop
In the previous blog post Ned discussed the basics of loop calibration. Now, let’s watch a video on ...
Oct 20, 2016
Loop calibration basics
Update February 2026: We have published an updated article about loop calibration. Read it here: ...
Oct 13, 2016
How to implement calibration software
Getting calibration software is much more than just selecting the right product and buying the ...
Oct 07, 2016
How to calibrate an RTD HART temperature transmitter
The temperature transmitter is a popular instrument in process plants. Like most transmitters, it ...

Sep 30, 2016
What is a documenting calibrator and how do you benefit from using one?
Figure 1. The calibration process with and without a documenting calibrator.
Sep 21, 2016
How to calibrate HART pressure transmitters
A pressure transmitter is one of the most common instruments in a process plant. In order to assure ...
Sep 16, 2016
Why and how to calibrate WirelessHART transmitters?
In one of our previous blog posts we took a general look at how to calibrate smart transmitters. ...
Sep 14, 2016
How a modern calibration process improves power plant performance
Today we will take a quick look into a power plant and discuss why it is beneficial to have a ...
Sep 09, 2016
Why must also "Smart" transmitters be calibrated?
The so called "Smart" transmitters are getting ever more popular in the process industry, but what ...
Sep 07, 2016
ISO9001:2015 – how do the changes affect your calibration process?
The ISO9001 standard was revised in 2015. In this blog, I will examine the main changes. And as I ...
.png)
Mar 01, 2016
The key aspects of building a calibration system business case
An investment into calibration equipment and systems must be financially justified, just like any ...
Feb 23, 2016
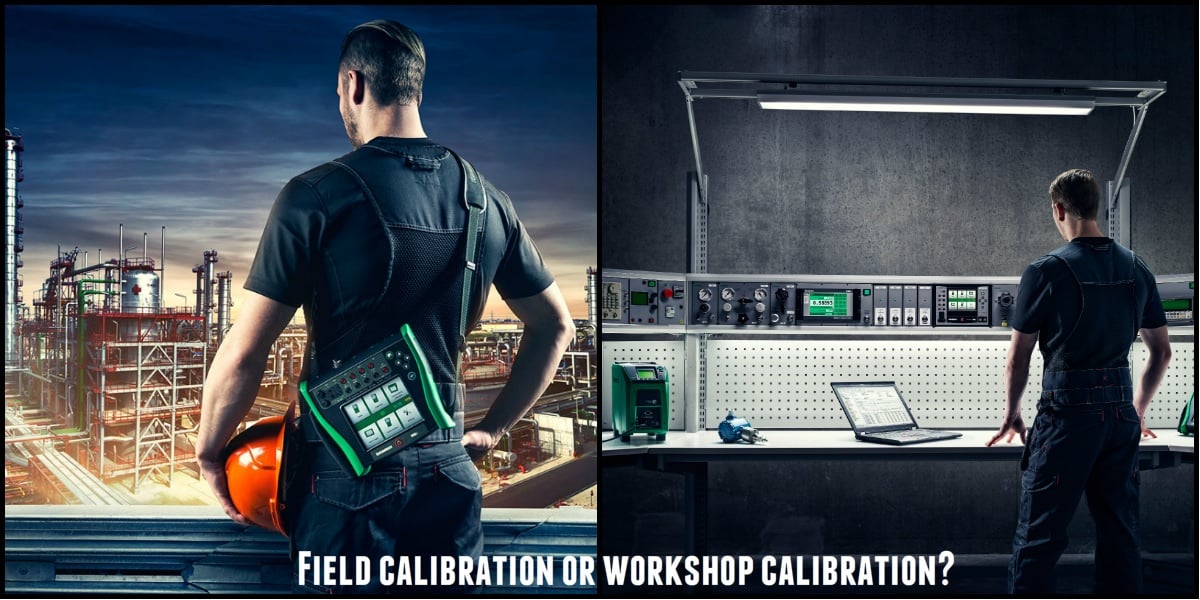
Field Calibration or Workshop Calibration?
We are sometimes asked if it is better to calibrate process instruments in the field, or in a ...
Jan 26, 2016
Calibration of a HART transmitter and the most common misconceptions about a HART communicator
A HART transmitter is the most common smart transmitter type used in the process industry. What ...
Jan 18, 2016
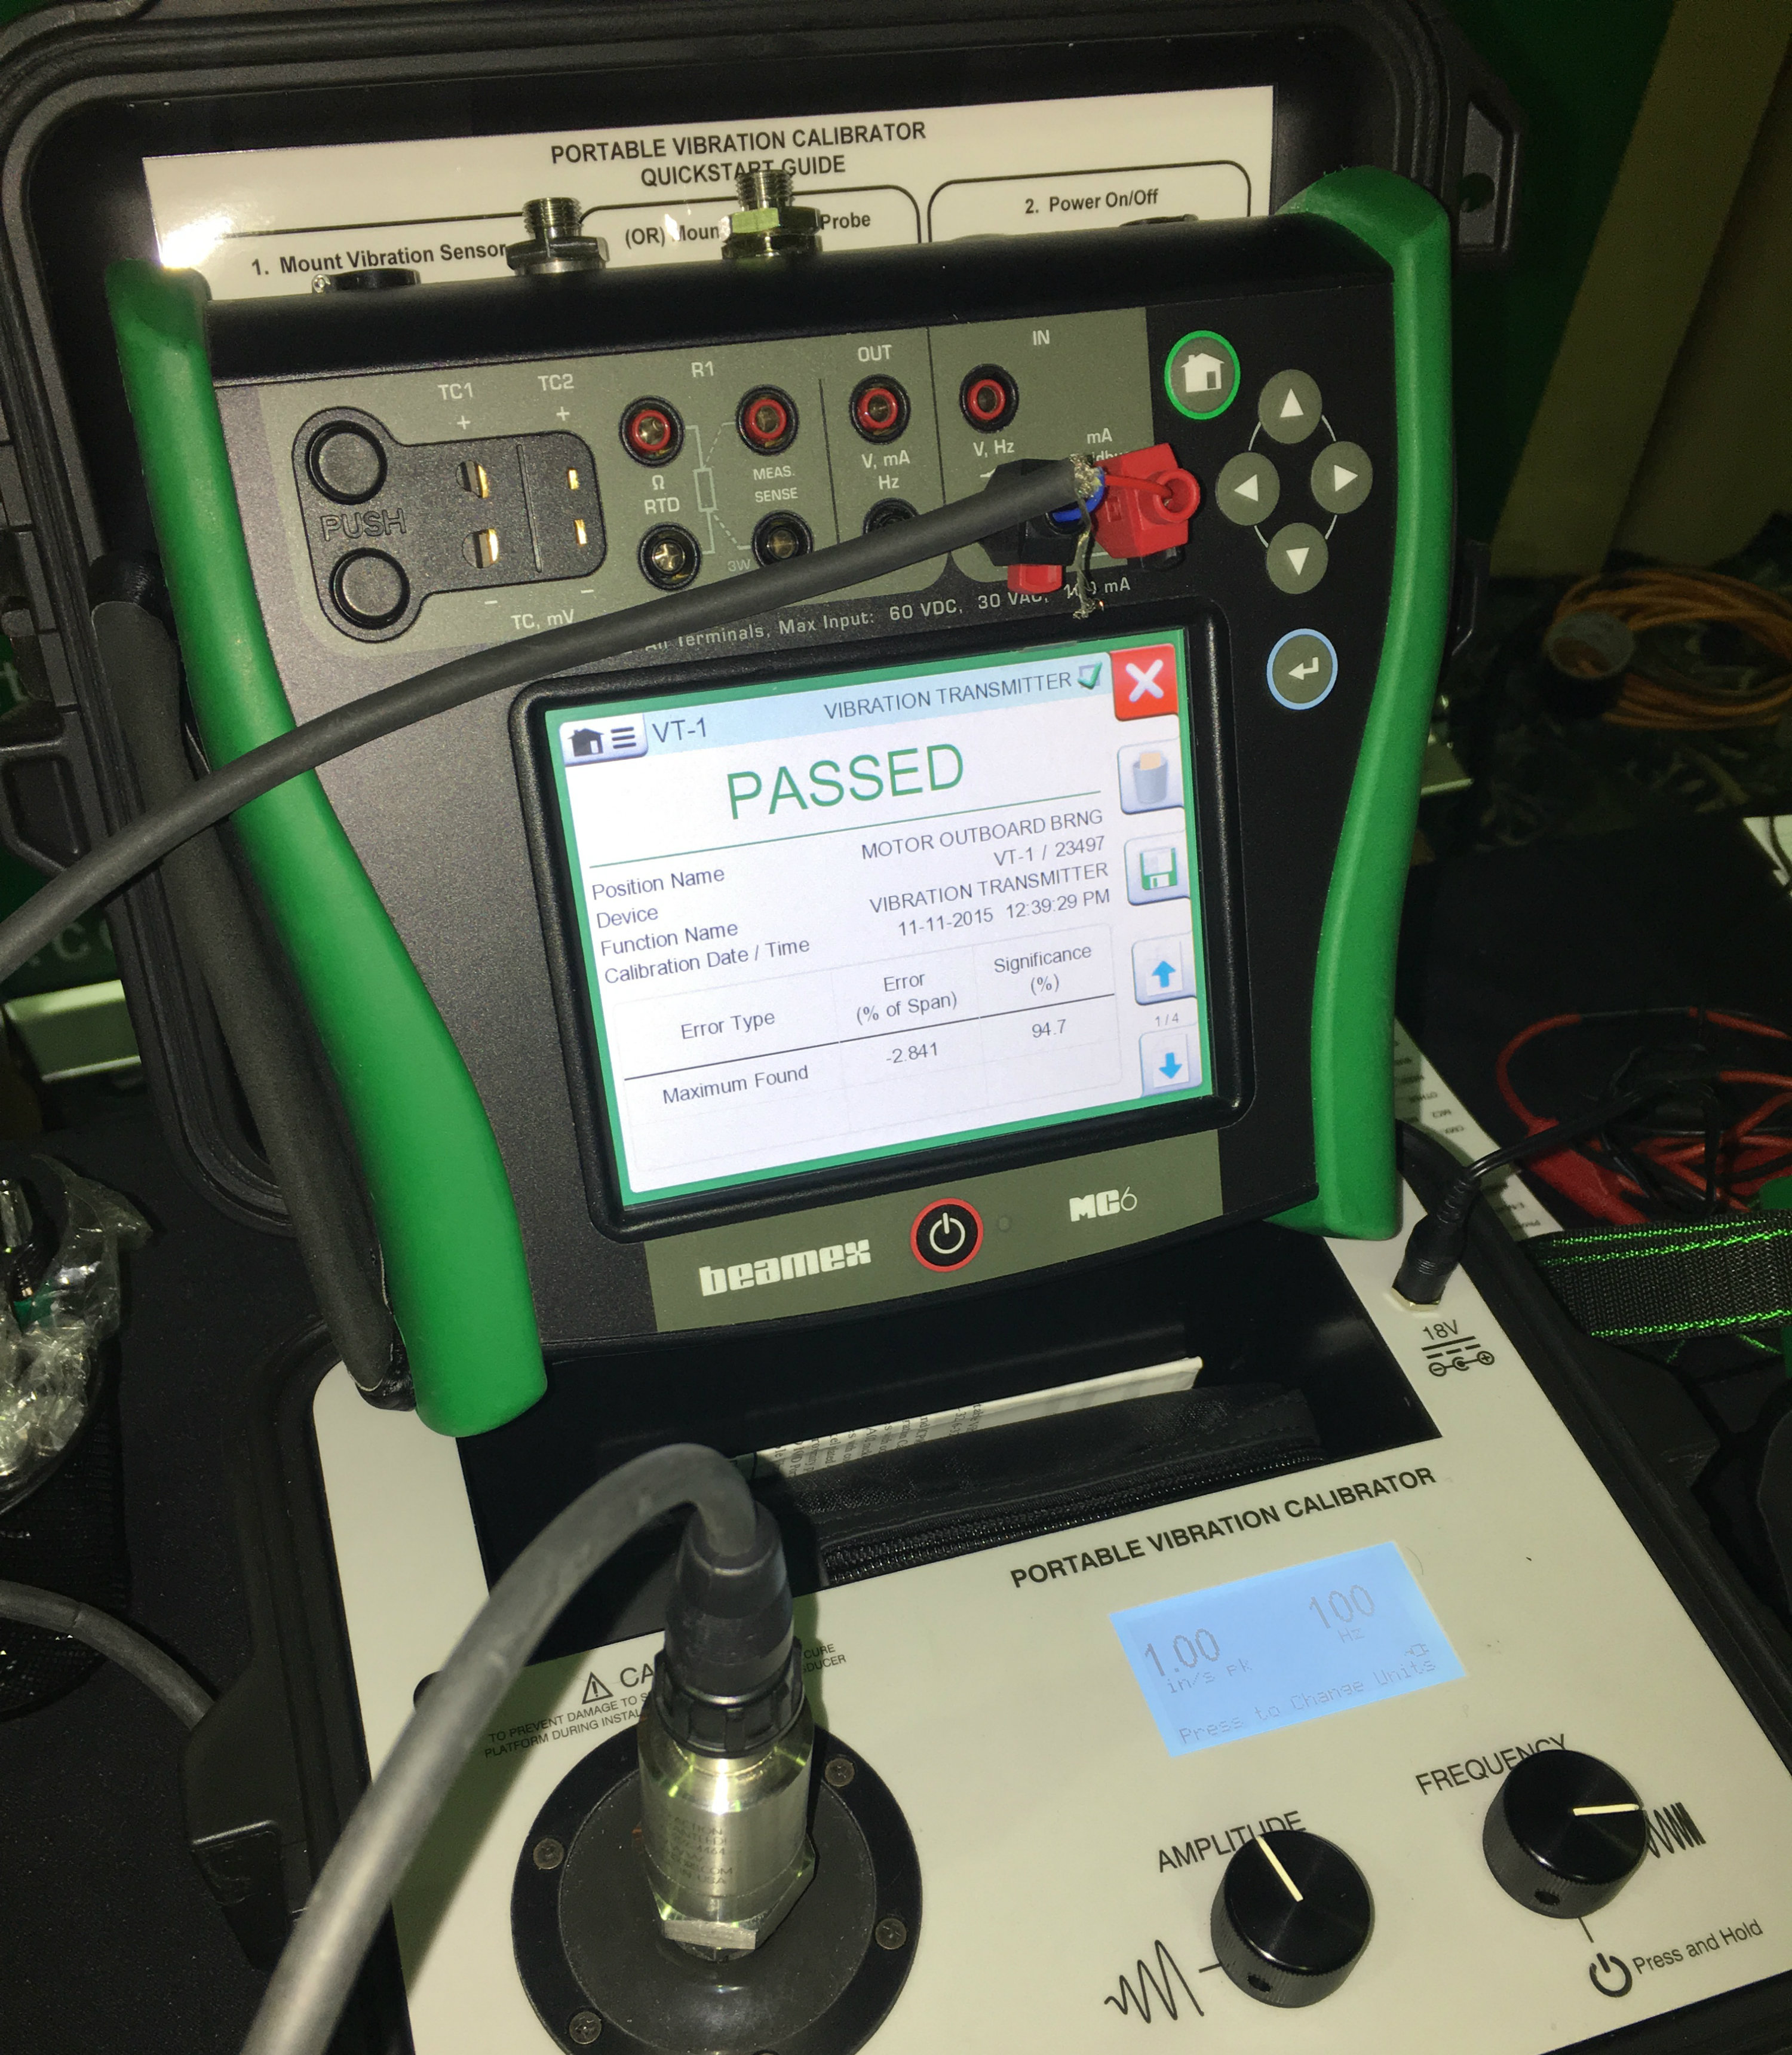
Vibration measurements and calibration
Seismic velocity measurements provide ideal resolution at typical rotating equipment running ...
Dec 10, 2015
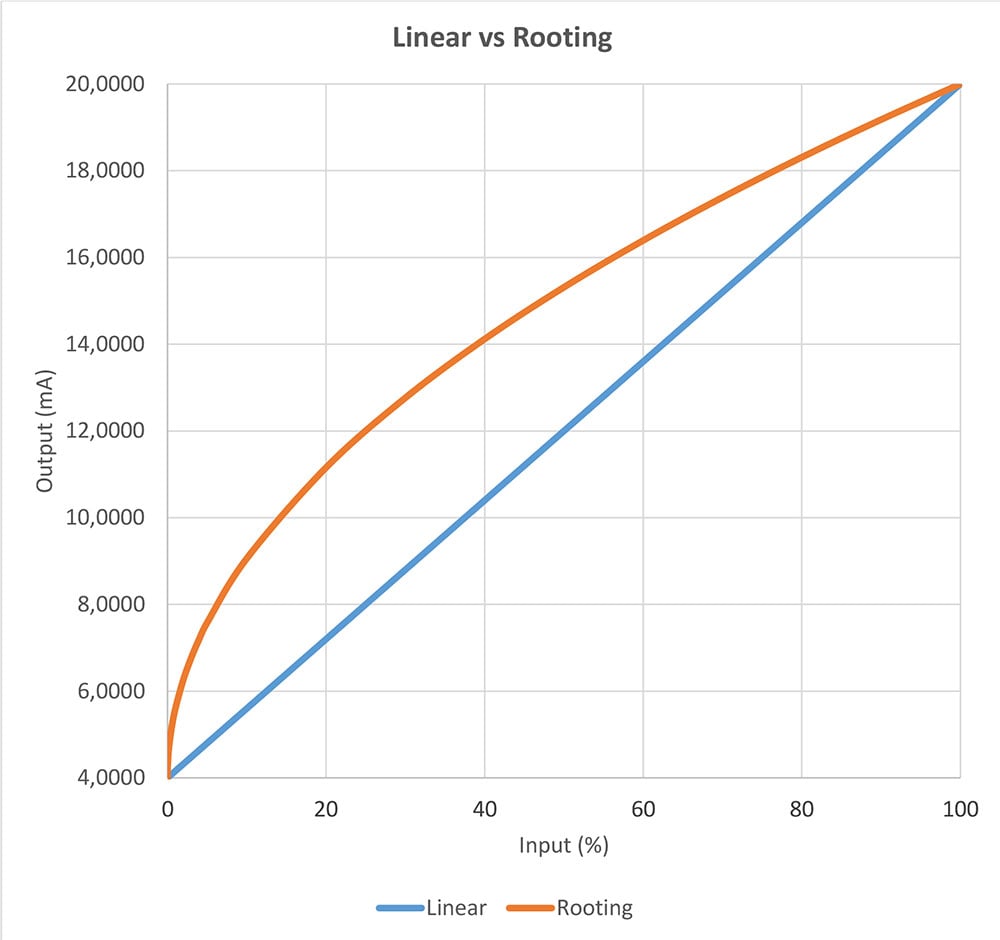
Calibrating a square rooting pressure transmitter
We quite often receive questions regarding the calibration of a square rooting pressure ...
Dec 07, 2015
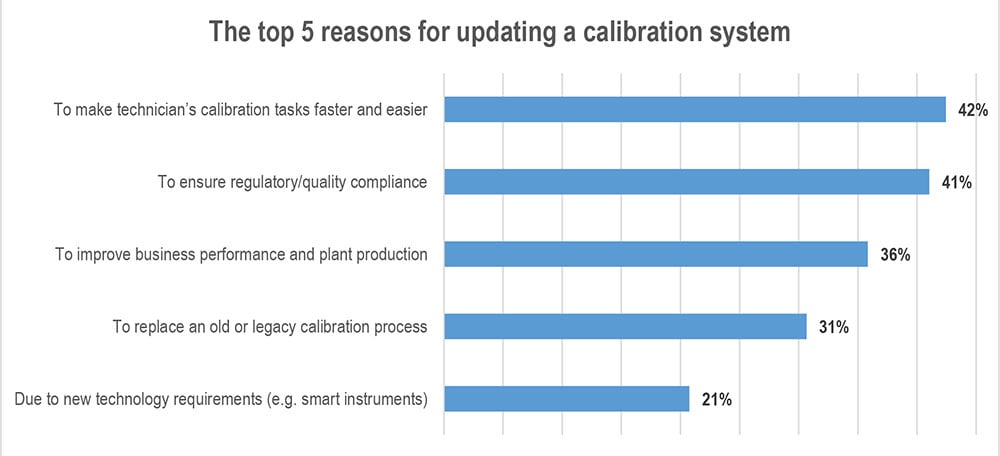
Top 5 reasons why companies update their calibration systems
As many as every fourth company in the process industry is at the moment considering to make some ...
Nov 27, 2015
Why calibrate?
Hi all, In this blog post we’ll continue to talk about another fundamental topic: Why should you ...
Nov 27, 2015
What is calibration?
Hello readers, As this is a calibration blog, I will begin with writing a short post on a very ...